In this example we will show how we can use two or more different parameters to filter out the data from the Event API endpoint using PowerBI/ Excel and python. The Event API endpoint shows the data of the list of emergencies as well as the associated appeals filed by the various red cross national societies. It is not necessary that an emergency is always associated with an appeal.
¶ API Endpoint
In this example we will be using two different filters namely regions_in and disaster_start_date__gte. The first parameter can be used to filter out the data for any particular IFRC region and the second filter is used to filter out the emergencies or disasters based on the specified date and time. The second parameter will provide us with a list of all disasters that occurred on and after the specified date. In this example we will be retrieving the data of emergencies for Africa region occurring after 1st January 2012. To access the data for emergencies, the URL of the API endpoint is given below:
https://goadmin.ifrc.org/api/v2/event/?disaster_start_date__gte=2012-01-01T00%3A00%3A00®ions__in=0
As can be seen above we will use two parameters to filter out the list of emergencies. It is to be noted that in this request URL, the %3A is a URL-encoded representation of the colon (:) character.
¶ Using PowerBI/Excel
The steps needed to obtain data in PowerBI/Excel are similar to the steps shown in other Sample API Queries. However, there are some modifications required to obtain and transform the data when using two or more parameters to filter the data. These modification are mentioned below:
- After opening the Power query editor, we have to define a parameters table which will contain the Authorization token along with with two other parameters which will be used for filtering out the data. The two other parameters are named as
regionanddisaster_start_date_gtedate in the parameters table. - Under the Home ribbon, from New Source, select Blank Query. Click on Advance editor, this will open the advance editing dialog box. In this advance editor window, paste the following code:
let
    // Get the parameter values
    ParametersTable = Parameters,
    Token = Table.SelectRows(ParametersTable, each [Column1] = "Token"){0}[Column2],

    region = Table.SelectRows(ParametersTable, each [Column1] = "region"){0}[Column2],
    disaster_start_date_gte = Table.SelectRows(ParametersTable,each[Column1] = "disaster_start_date_gte"){0}[Column2],

    BaseUrl = "https://goadmin.ifrc.org/api/v2/event/",
    PageSize = 50,  // Number of items per page

    // Construct the query based on parameter values
    regionFilter =

        if region <> null then
            "?regions__in=" & Text.From(region)
        else
            "" ,
    dateFilter =

        if disaster_start_date_gte <> null then

            if Text.Length(regionFilter) > 0 then

                "&disaster_start_date__gte=" & Text.From(disaster_start_date_gte)

            else

                "?disaster_start_date__gte=" & Text.From(disaster_start_date_gte)

        else
            "",

    GetPage = (page) =>
        let
            Url = BaseUrl & regionFilter & dateFilter &
            (if Text.Length(regionFilter) > 0 or Text.Length(dateFilter) > 0 then "&" else "?") &
            "limit=" & Text.From(PageSize) & "&offset=" & Text.From(page * PageSize),
            Headers = if Token <> null then [#"Accept-Language"="en", #"Authorization"="Bearer " & Token] else [#"Accept-Language"="en"],
            Response = Json.Document(Web.Contents(Url, [Headers=Headers])),
            Results = Response[results]
        in
            Results,

    CombineAllPages = List.Generate(
        () => [Page = 0],
        each List.Count(GetPage([Page])) > 0,
        each [Page = [Page] + 1],
        each GetPage([Page])
    ),
    #"Converted to Table" = Table.FromList(CombineAllPages, Splitter.SplitByNothing(), null, null, ExtraValues.Error),
    #"Expanded Column1" = Table.ExpandListColumn(#"Converted to Table", "Column1")
in
#"Expanded Column1" As you can see that the code is dynamically building a URL query string based on the conditions of the region and disaster_start_date_gte variables. The summarized explanation of the two parameters used to filter out the data is given below:
regionFilter: It checks if the variable region is not null. if the region variable is not null then it assigns a string to theregionFilterin the form of?regions__in=followed by the string representation of the region. If the region is null then it assigns an empty string to theregionFilter.dateFilter: It checks if thedisaster_start_date_gteis null or not. It then further check is the length of theregionFilteris greater than 0 and if this is the case it appends the disaster start date filter using"&disaster_start_date__gte="followed by the string representation ofdisaster_start_date_gte. if theregionFilteris empty it assigns a string to thedateFiltercontaining the disaster start date filter in the form of"?disaster_start_date__gte="followed by the string representation ofdisaster_start_date_gte.
- After the code has been pasted in the advance editor window, click on done. A series of steps will be added in the APPLIED steps on the right side of the query editor.
- After that the data can be expanded by selecting the necessary features/ columns. We can do this by clicking on the icon next to the name of the column.
- At this moment we will be expanding the columns of field_reports and countries columns because we would like to plot the top 10 countries with the most number of deaths.
- User can select any number of fields from the above mentioned columns but it is necessary to select
countries.nameandfield_reports.govt_num_injuredfrom thecountriesandfield_reportscolumns respectively. - Now we are able to see what data this query is actually providing. Also ensure that columns have correct data type so that visualization process can proceed without errors. We're ready to start building our visuals, so click on Close and Apply at the top of your Power Query Editor Window.
¶ Visualization in Power BI
We will be visualizing the top 10 countries in Africa with the most number of deaths which will be further classified according to the disaster type. For this purpose we will be using the stacked bar chart visualization. The following steps can be followed:
- First select the stacked bar chart from the visualization pane and upon selection a blank placeholder will appear in the preview pane.
- From the data tab select the table which has the data of the events occurring in Africa. Drag the fields named
countries.nameinto the Y-axis. After that drag the field namedfield_reports.govt_num_injuredinto the X-axis. Power Bi will automatically show the countries with the number of deaths. - Next drag the field named
dtype.nameinto the Legend. The dtype.name contains disaster category names. - After that apply the filter Top N on countries.name and select N value as 5 to display the top 5 African countries with the most number of deaths along with the disaster type.
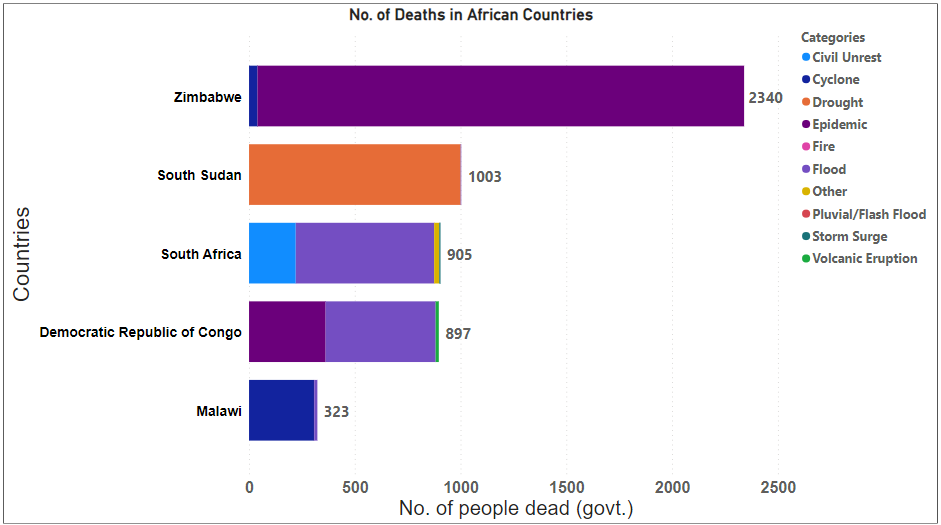
The visualization can be customized by changing the title names, sizes and colors of the labels. The following stacked bar chart visualization has been obtained after applying all the above steps with user's own customization.
We can see that Zimbabwe has the highest number of deaths of around 2340 as reported by the government. The major cause of these deaths was Epidemics.
¶ Using Python
To retrieve and analyze data using python, the following code can be used in jupyter notebooks. First we import the requests library which is used to send HTTP request to the API endpoint. Along with that we also import the matplotlib library for plotting the figure.
import requests
import matplotlib.pyplot as pltNext we define a function called fetchEvents to retrieve the data of emergency events. While retrieving the data we use two parameters namely regions_in and disaster_start_date_gte to filter the data according to the region and a starting date. The function will search for the data in all API pages and return the results in a list.
def fetchEvents(regions_in, disaster_start_date_gte):
    base_url = "https://goadmin.ifrc.org/api/v2/event/"
    offset = 0
    page_size = 50
    all_results = []
    auth_token = "your authorization token"

    while True:
        params = {
            "regions__in": regions_in,
            "disaster_start_date__gte": disaster_start_date_gte,
            "offset": offset,
            "limit": page_size
        }

        headers = {
            "Authorization": f"Bearer {auth_token}"
            # Add other headers if needed
        }

        response = requests.get(base_url, params=params, headers=headers)
        data = response.json()
        events = data.get("results", [])

        if not events:
            # No more results, break the loop
            break

        # Add fetched events to the results list
        all_results.extend(events)

        # Increment offset for the next page
        offset += page_size

    return all_results
After defining the function for retrieving the data we specify our search parameters. Here we will searching for emergency events in Africa occurring after 2012. We call the functions with the search parameters and convert the result into a pandas data frame.
regions_in = "0"  # Replace with your desired region IDs
disaster_start_date_gte = "2012-01-01T00:00:00"  # Replace with your desired start date
events_data = fetchEvents(regions_in, disaster_start_date_gte)
df = pd.DataFrame(events_data)
In the next steps we perform a series of data transformation processes. We make separate data frames for country names, number of deaths occurring due to disaster/ emergency as well as disaster/emergency category. Finally we concatenate these three datasets into a single dataset and name it as df_final.
df = df.explode("countries")
df = df.explode("field_reports")
df_country = pd.DataFrame(
    [country["name"] if pd.notnull(country) else None for country in df.countries],
    columns=["country.name"],
)

gov_num_dead_list = pd.DataFrame(
    [x["gov_num_dead"] if pd.notnull(x) else None for x in df["field_reports"]],
    columns=["num_dead"],
)

df_dtype = pd.DataFrame(
    [name["name"] if pd.notnull(name) else None for name in df["dtype"]],
    columns=["dtype.name"],
)
df_final = pd.concat([df_dtype, df_country, gov_num_dead_list], axis=1)
Again we carry out a series of data transformation processes to extract the data of top 5 countries in Africa with the most number of deaths. We group the data according to country name and disaster/ emergency type and calculate the total number of deaths. We store this result into a new data frame and name it as grouped_df. Later we select the top 5 countries based on the total number of deaths and store the result in the data frame grouped_top_df.
# Group by 'country.name' and 'dtype.name', summing the 'num_dead' values
grouped_df = (
    df_final.groupby(["country.name", "dtype.name"])["num_dead"].sum().reset_index()
)

# Select the top 5 countries based on the sum of 'num_dead'
top_countries = grouped_df.groupby("country.name")["num_dead"].sum().nlargest(5).index
grouped_top_df = grouped_df[
    grouped_df["country.name"].isin(top_countries)
].reset_index()

grouped_top_df["num_dead"] = grouped_top_df["num_dead"].astype(int)

sorted_df = (
    grouped_top_df.groupby("country.name")["num_dead"]
    .sum()
    .reset_index()
    .sort_values(by="num_dead", ascending=True)
)

# Reorder the 'country.name' column based on the sorted order
grouped_top_df["country.name"] = pd.Categorical(
    grouped_top_df["country.name"], categories=sorted_df["country.name"], ordered=True
)
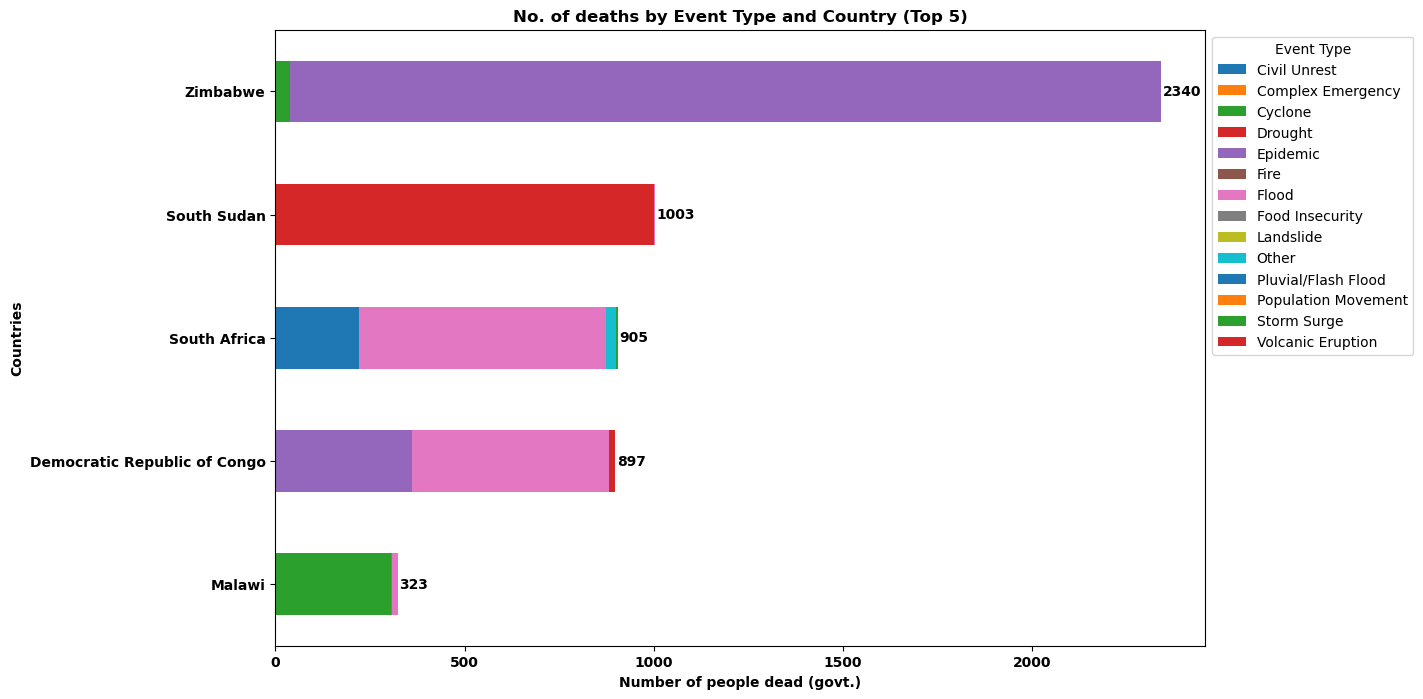
Finally we plot the results for the top 5 countries in Africa with the most number of deaths categorized by disaster/ emergency type. we plot the results in a horizontal stacked bar/column chart. Users can specify and change the plotting style/ color or theme. We can clearly see from the figure that Zimbabwe registered the highest number of deaths and highest proportion of deaths in Zimbabwe occurred to due various Epidemics.
# Plot data in a horizontal stacked bar manner
ax = df_pivoted.plot(kind="barh", stacked=True, figsize=(12, 8))

# Add data labels for the total values next to each bar
for idx, value in enumerate(df_pivoted.sum(axis=1)):
    ax.text(value + 5, idx, str(int(value)), va="center", fontweight="bold")


# Add labels
plt.xlabel("Number of people dead (govt.)", fontweight="bold")
plt.ylabel("Countries", fontweight="bold")

# Make labels and ticks bold
plt.xticks(fontweight="bold")
plt.yticks(fontweight="bold")

plt.title("No. of deaths by Event Type and Country (Top 5)", fontweight="bold")
plt.legend(title="Event Type", bbox_to_anchor=(1, 1))