In this example we will access the data from the Projects API endpoint and visualize the number of projects as per the status using PowerBI and Python. Projects in a country have been classified into three categories namely:
- Planned
- Ongoing
- Completed
¶ API Endpoint
To access the data of Projects, we will be using the Projects API endpoint. We will be accessing the projects in Sudan and this can be achieved by setting the parameter Country to Sudan. In the API URL, we need to specify the 3 letter ISO3 code for Sudan which is “SDN”.
So the URL for accessing the data would look like this:
https://goadmin.ifrc.org/api/v2/project/?country=SDN
¶ Using Power BI/ excel
The procedure for getting the data in Power BI is similar to what has been done in the Projects per Sector page.
- Select the Transform data from the top ribbon to open the Power Query editor.
- Define a parameters table which will contain the Authorization token and country ISO3 code as parameters. We can construct a table by clicking on the Enter Data option under the Home ribbon and write the Authorization code and 3 letter ISO3 code. In this example we will querying the data for Sudan which has
SDNas the ISO3 code. - Click Ok and a new query will be generated under the Queries window. We rename this query as Parameters.
- Now we will construct another query which will be used in fetching the data from the Projects API endpoint. Under the home ribbon, from New Source, select Blank Query. Click on Advance editor, this will open the the Advance query editor dialog box. In the Advance editor window we have to paste the code below. The only difference we observe is the change of ISO3 code to
SDNfor Sudan.
let
    // Get the parameter values
    ParametersTable = Parameters,
    Token = Table.SelectRows(ParametersTable, each [Column1] = "Token"){0}[Column2],

    country = Table.SelectRows(ParametersTable, each [Column1] = "country_iso3"){0}[Column2],


    BaseUrl = "https://goadmin.ifrc.org/api/v2/project/",
    PageSize = 50,  // Number of items per page

    // Construct the query based on parameter values
    filter =

        if country <> null then
            "?country=" & Text.From(country)
        else
            "?" ,

    GetPage = (page) =>
        let
            Url = BaseUrl & filter & "&limit=" & Text.From(PageSize) & "&offset=" & Text.From(page * PageSize),
            Headers = if Token <> null then [#"Accept-Language"="en", #"Authorization"="Bearer " & Token] else [#"Accept-Language"="en"],
            Response = Json.Document(Web.Contents(Url, [Headers=Headers])),
            Results = Response[results]
        in
            Results,

    CombineAllPages = List.Generate(
        () => [Page = 0],
        each List.Count(GetPage([Page])) > 0,
        each [Page = [Page] + 1],
        each GetPage([Page])
    ),
    #"Converted to Table" = Table.FromList(CombineAllPages, Splitter.SplitByNothing(), null, null, ExtraValues.Error),
    #"Expanded Column1" = Table.ExpandListColumn(#"Converted to Table", "Column1")
in
    #"Expanded Column1"
- After the code has been pasted in the advance editor window, click on done. A series of steps will be added in the APPLIED STEPS on the right side of the query editor window.
- After that we need to expand the data and selecting the necessary features/ columns. we can do this by clicking on the icon next to the name of the column.
- At the moment we will select only a few columns namely: primary_sector_display, secondary_sectors_display, operation_type_display, programme_type_display and status_display.
- Now we’re able to see what data this query is actually providing us! We’re ready to start building our visuals, so click Close and Apply at the top of your Power Query Editor window
¶ Visualization in PowerBI
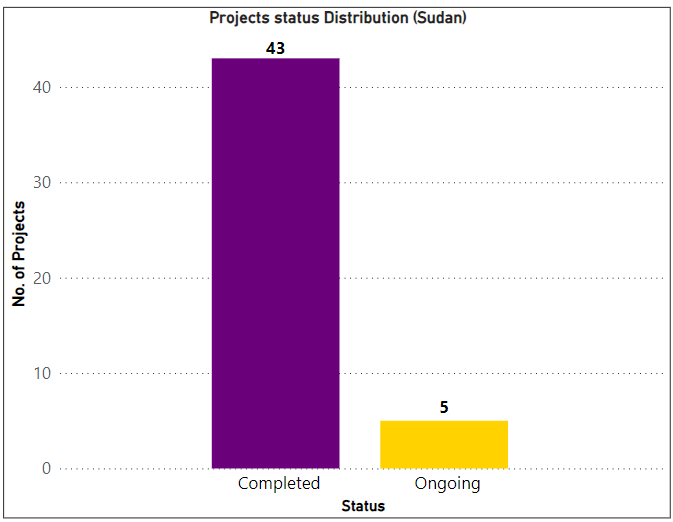
The steps to visualize the events in countries are similar to what has been shown in Projects per Sector page. We can build the chart by selecting the bar chart from the visualization section. After this selection, a blank place holder will appear in the preview pane. From the data tab select the table which has the data of the projects in countries and find the status_display field. To show the data on the chart you need to drag this field in the X-axis and Y-axis. Power BI will automatically display the frequency/ count of the projects by their status and construct the bars bars showing the project statuses. The data labels to show the number of projects can be shown by enabling the Data labels from the format option under the visualizations option.
The Bar chart can be customized, for example by changing the names, sizes and colors of the axis, titles and bar colors. The following chart can be obtained after applying the above steps with user's own customizations.
¶ Using Python
In this section, we will show how data for projects in Sudan can be retrieved from the API endpoint and visualized using python. Following Python code can be used in Jupyter notebooks. Jupyter notebooks area a popular cloud base interface that allows the users to create and share documents with code, equations, visualization and text.
To start the process, we first have to import the following python libraries:
Requests: For sending HTTP request to the API endpointMatplotlib.pyplot: Provides a MATLAB-like interface for creating static, interactive and animated visuals in Python.Numpy: Provides support for creating and handling large, multidimensional arrays and matrices.
import requests
import matplotlib.pyplot as plt
import numpy as np
auth_token = 'Your authorization token'Next we define a function named fetch_project_data. This function is receives data from the API endpoint specified by the API URL and parameters. It iteratively fetches data from all pages in the API response and stores them in a list named all_projects. After fetching, it processes the data to create status_counts dictionary, counting the occurrence of each project status. The function returns a dictionary, summarizing the counts of project statuses obtained from the API.
def fetch_project_data(api_url, params, headers):

    all_projects = []

    # Fetch data from all pages of the API endpoint
    while True:
        response = requests.get(api_url, params=params, headers = headers)
        page_data = response.json().get("results", [])
        all_projects.extend(page_data)

        # Check if there are more pages
        next_page = response.json().get("next")
        if next_page:
            params["offset"] += params["limit"]  # Move to the next page
        else:
            break  # No more pages, exit the loop

    # Process data and generate status counts
    status_counts = {}
    for project in all_projects:
        status = project.get("status_display")
        if status in status_counts:
            status_counts[status] += 1
        else:
            status_counts[status] = 1
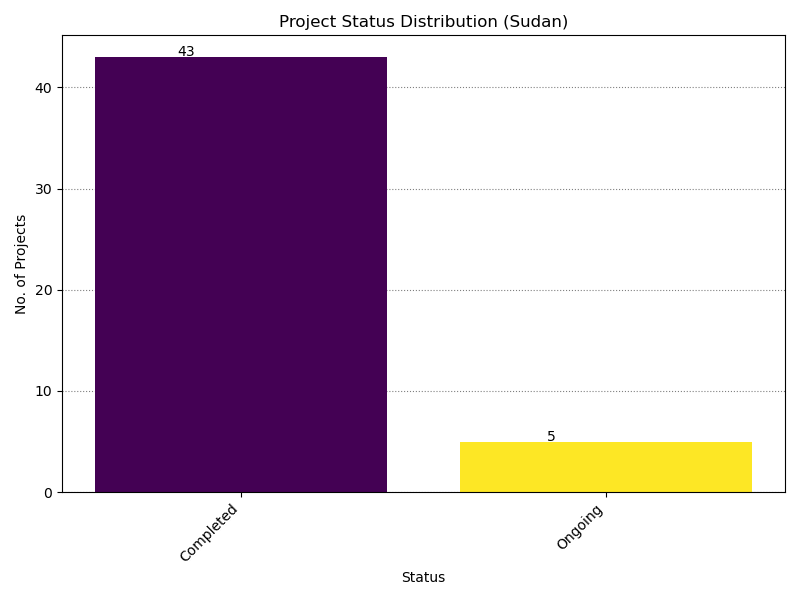
return status_countsThe plot_status_distribution function takes a dictionary status_counts containing the counts of projects statuses. It is used to generate a bar chart to visualize the distribution of project statuses. The resulting plot provides a visual representation of the distribution of projects as per their status in Sudan.
def plot_status_distribution(status_counts):

    status_labels = list(status_counts.keys())
    status_data = list(status_counts.values())

    # Generate a list of colors based on the number of status_labels
    num_colors = len(status_labels)
    colors = plt.cm.viridis(np.linspace(0, 1, num_colors))

    # Create a bar chart
    plt.figure(figsize=(8, 6))
    bars = plt.bar(status_labels, status_data, color= colors)

    # Annonate bars with data labels
    for bar, labels in zip (bars, status_labels):
    	plt.text(bars.get_x() + bars.get_width()/2 - 0.15, bars.get_height()+0.1, str(label),
    	ha = 'center', fontsize = 10, zorder = 3)
    plt.xlabel('Status')
    plt.ylabel('# of Projects')
    plt.title('Project Status Distribution')
    plt.xticks(rotation=45, ha="right")
    plt.tight_layout()
    plt.show()
Lastly, we specify the, API URL, params and headers. We call the helper functions defined before to first fetch the projects data in Sudan and then use the plot_status_distribution function to visualize the number of projects in Sudan as per their status.
# Define the API endpoint URL and initial parameters
api_url = "https://goadmin.ifrc.org/api/v2/project/"
params = {
    "country_iso3": "SDN",
    "limit": 50,
    "offset": 0,
}  # Initial parameters for the first page

headers = {"Authorization": f"Bearer {auth_token}"}


# Fetch project data and plot the status distribution
status_counts = fetch_project_data(api_url, params, headers)
plot_status_distribution(status_counts)