The Country pages provides in-depth information about the selected country, offering users comprehensive details about the particular geographic area. Users can access a full spectrum of information related to the selected country with in this section of the Go platform.
The Country Pages provide information about the following four major components namely:
- Ongoing Activities
- National Society Overview
- Country Profile
- Additional data
¶ Ongoing Activities
This section of the country pages provides information about the ongoing emergencies and projects with in the country as reported by the National societies and partners. The displayed data is based on reporting and may not be fully indicative of all the ongoing activities.
¶ Ongoing Emergencies
Under the Ongoing emergencies section users can access information related to the ongoing emergencies with in the countries as reported by the National Societies and partners.
¶ 1) Key Numbers
The first thing displayed under this section are the key numbers related to the emergencies. It shows information related to the total number of i) Active DREF operations, ii) Active Emergency Appeals, iii) Targeted Population, iv) Funding Requirements (CHF) and v) Funding Coverage. These numbers are displayed in the form of cards. The cards change numbers according to the page subject (Home/ Region/ Country).

¶ 2) Active Operations
Below the above mentioned key numbers, users can see the bars/ cards showing the information related to the Active Operations in the country/ region. These cards and bars display information about the targeted population and funding coverage in the selected country.

¶ 3) Operations Map
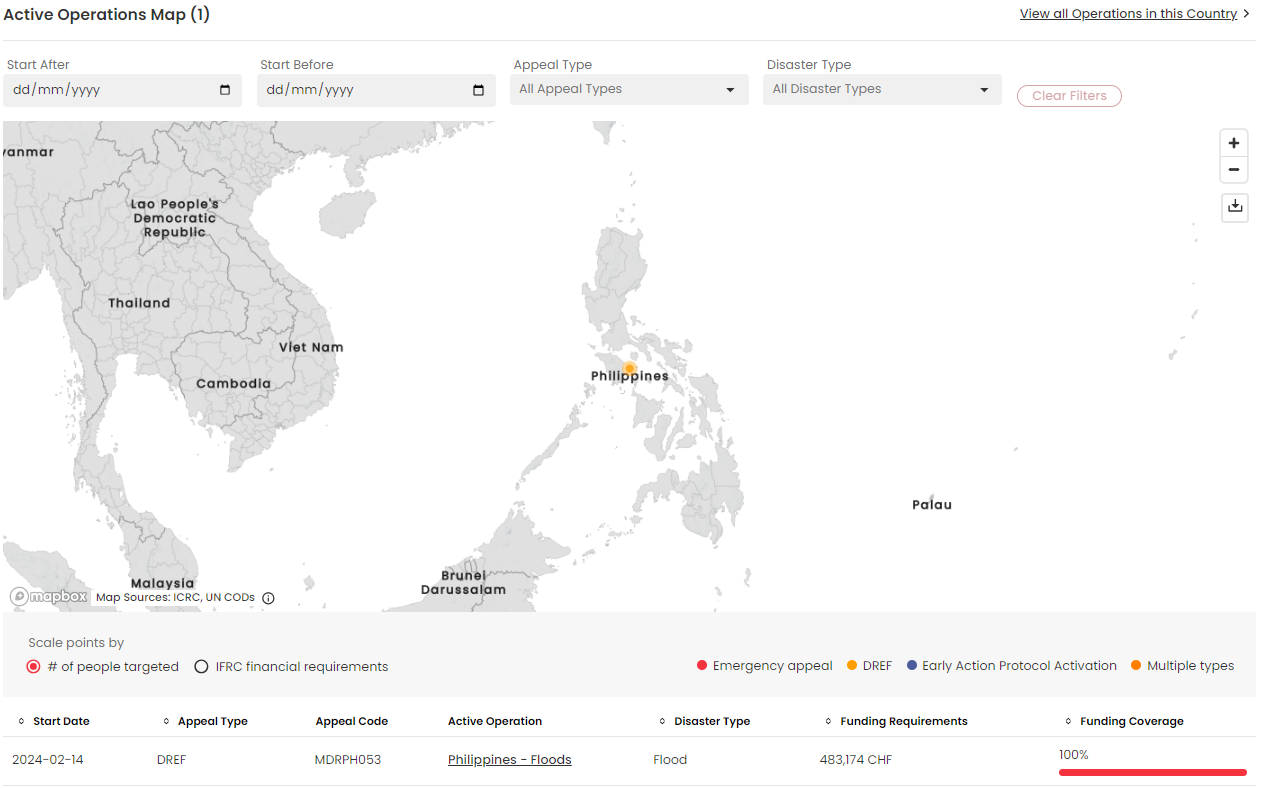
This section displays the map of the country with the ongoing emergency and details of the respective emergencies are displayed when the user clicks on the affected country. The emergency details are displayed in the form of tooltip. The following information is displayed on the Operations Map:
- Name of the Country
- Crisis Categorization
- Start Date
- Operation Type
- Rapid Response Personnel (RRP) requested
- Targeted Population
- Funding Requirements and Funding Coverage
The operations map can also be filtered based on start dates of the emergency/ disaster, appeal type and disaster type.
Below this map, users can also see the information about the emergencies in the country in a tabular form.
¶ 4) Operational Learning
This section shows the previous learnings for the selected country to the user. Expanding the tiles in this section should take the user to the Operational Learning page pre-filtered with the details regarding the particular country.
¶ 3W Projects
This sections displays the information about the ongoing projects with in the country that are not linked to a specific emergency. The displayed data is based on reporting by the National societies and partners and may not be fully indicative of all the projects.
¶ 1) Key Numbers
The first thing visible to the users are the key numbers related to the ongoing projects with in the country. It displays information regarding the number of i) Active National societies associated with the projects, ii) Targeted Population, iii) Total Projects by programme types, iv) Total Budget of all the ongoing projects and v) Project status. The cards change numbers according to the page subject (Home/ Region/ Country).

¶ 2) Ongoing Projects
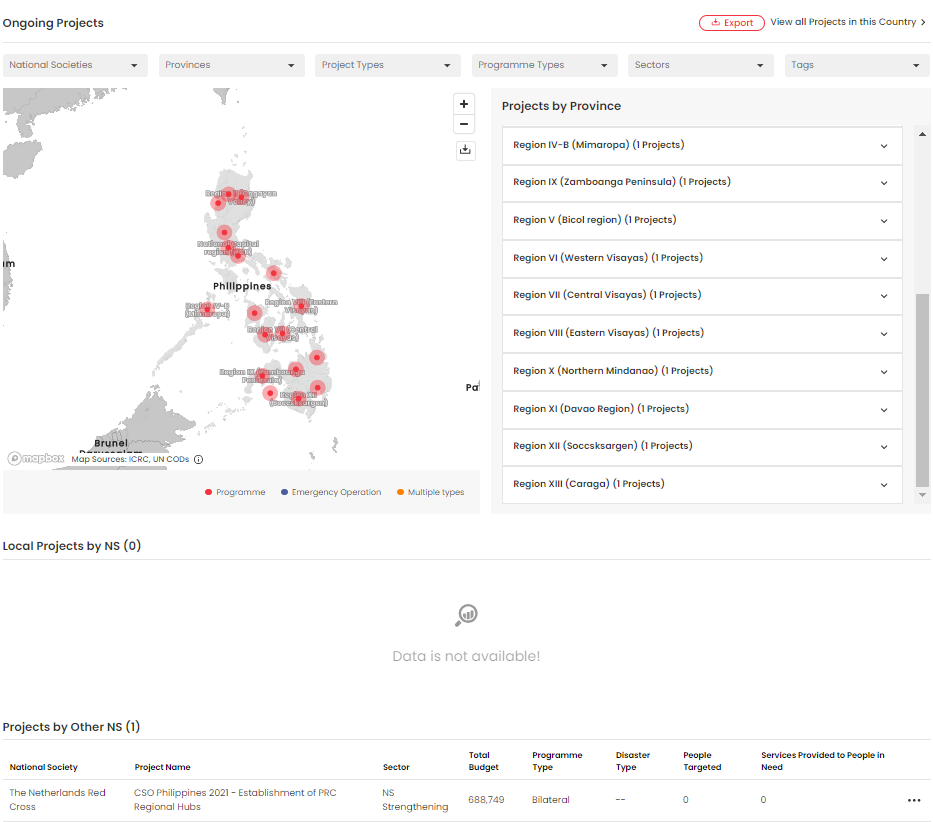
This section displays the information regarding all the projects with in the country in a form of map and tables to the user. The projects are characterized if it is a local project carried out by the National Society or some other projects carried out by a different National Society. The ongoing projects with in the respective provinces/ districts are displayed on the map of the country. The projects can be edited, duplicated and deleted. The list of projects can also be filtered using the filters shown just above the map. The projects can be filtered based on the national societies, provinces where they are undertaken, project sectors and status and associated tags if any.
¶ National Society Overview
In this section users can find information regarding national and international activities of a National Society reported through GO, its history and structure, focus areas and priorities of National Society, its capacity/ preparedness, action plans and works along with its partners.
¶ NS Activities
This section displays the international and domestic activities of a National Society reported through GO, which may include emergency and non emergency related projects. The displayed data is based on reporting and may not include all the activities of the National Society.
¶ 1) Key Indicators
This section presents the key indicators of a region or countries where a National Society is carrying out any project. It displays the information about the total number of i) Countries where International Work is going on, ii) number of Active Programes, iii) Targeted Population, iv) Funding Requirements and v) Funding Coverage.

¶ 2 NS International Projects Map
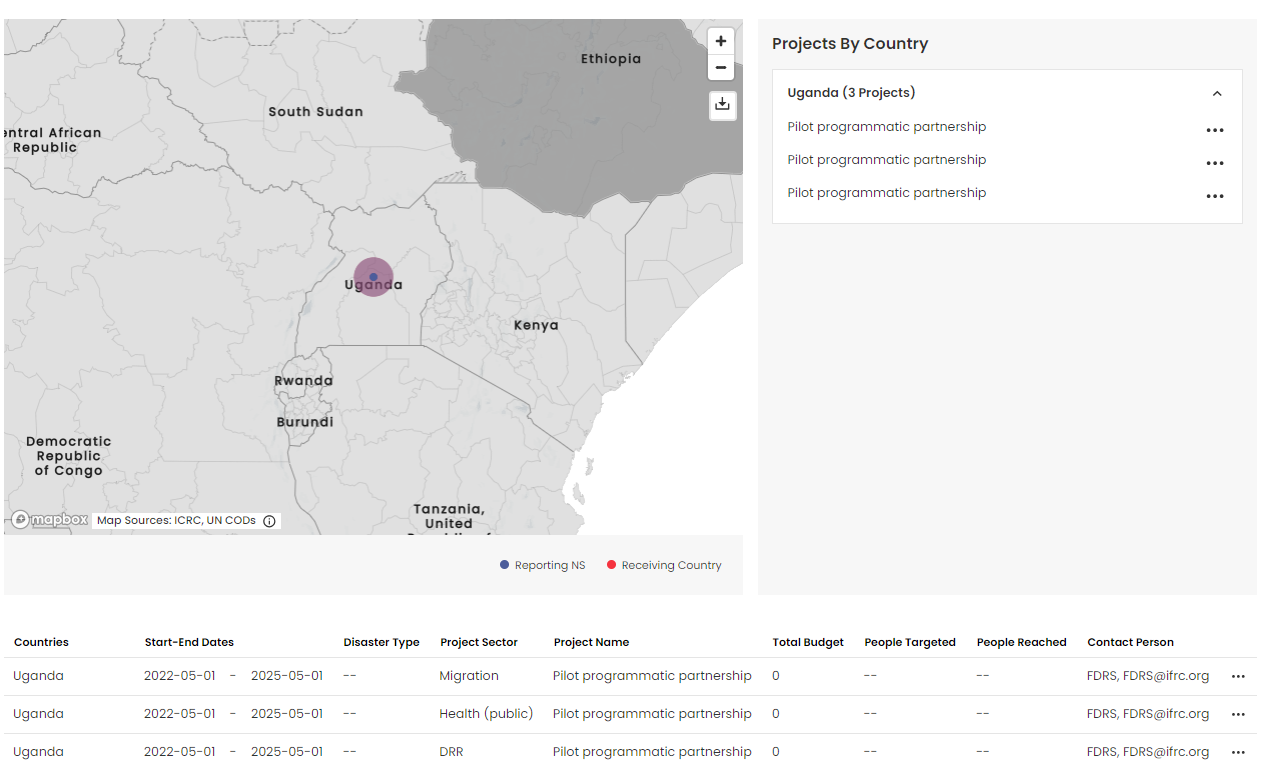
This map displays the country of the National Society as well as the countries where the NS has ongoing projects. Clicking over the project country displays information about the type and number of projects being carried out in that country. The details about domestic and international projects are also displayed in a tabular form just below the projects map.
¶ 3) NSD Funding Initiatives
The card represents the applications by the National Society for various funds to support the projects. The cards will show the active funds. Theses cards show information about the funding initiative name, funding type , category and year/ month of approval. A View all button to the right of the title is a link to a page where historical data is displayed., including completed and inactive funds, in a tabular view.

¶ Context and structure
This section provides a comprehensive breakdown of the organizational framework and key components of the National Society, offering an insightful overview of its structure. This section effectively presents a panoramic view of its organizational landscape, serving as a valuable primer on the society's structure
¶ 1. National Society Indicators
This section shows the key indicators of a specific National Society. It shows information such as date founded, income, expenditure, number of staff etc. On the right side of this card there is a button named Go to FDRS which will take the user to the Federation Wise Data Bank and Reporting System's page showing the full detains of the specific National Society. The i icon next to the indicator shows the detailed information about that particular indicator.

¶ 2. Key Links
This section displays all the useful links that have been used to locate the data on the pages as well as the useful data from IFRC, FDRS, etc. Clicking on the link will open it in a new tab of the browser.

¶ 3. NS Local Units
This section displays a map showing the location, address and website of the National Society as well as its local units. Each local unit shows a short description of the indicators when clicked. There is button named Add Local Units on the right side of this section. Clicking the button takes user to the Local unit management page. By default the popup should be empty, the user should chose the type.
Local units refer to all points of interest that belong to the National Society and directly engage with communities, delivering services to people. They encompass various organizational points of interest such as administrative offices, emergency response units, healthcare units, training and education centers, humanitarian assistance centers, and others that do not fit into the above categories.
Accessing the Module's User Interface:
The current version of the local units platform can only be accessed through the GO country pages by both logged-in and non-logged-in users. From the GO Home Page, navigate to Countries, click on a country of interest, go to National Society Overview tab, then Context and Structure tab, navigate down below National Society Indicators, then you will see NS Local Units. Non-logged-in users will only access the map view where they can see local units with public visibility on a map, with some filters and map tooltips with the name of the local unit, local unit type, address, and date of update. While logged-in users can view all what non-logged-in users see, they go a step further to access the list view with all the attributes. Logged-in users can edit the data on the front end and provide new local units points through a form. However, only GO NS Focal Point or GO Country Admin or Super Users will be able to validate the data.
Navigating Through the Local Units Dataset
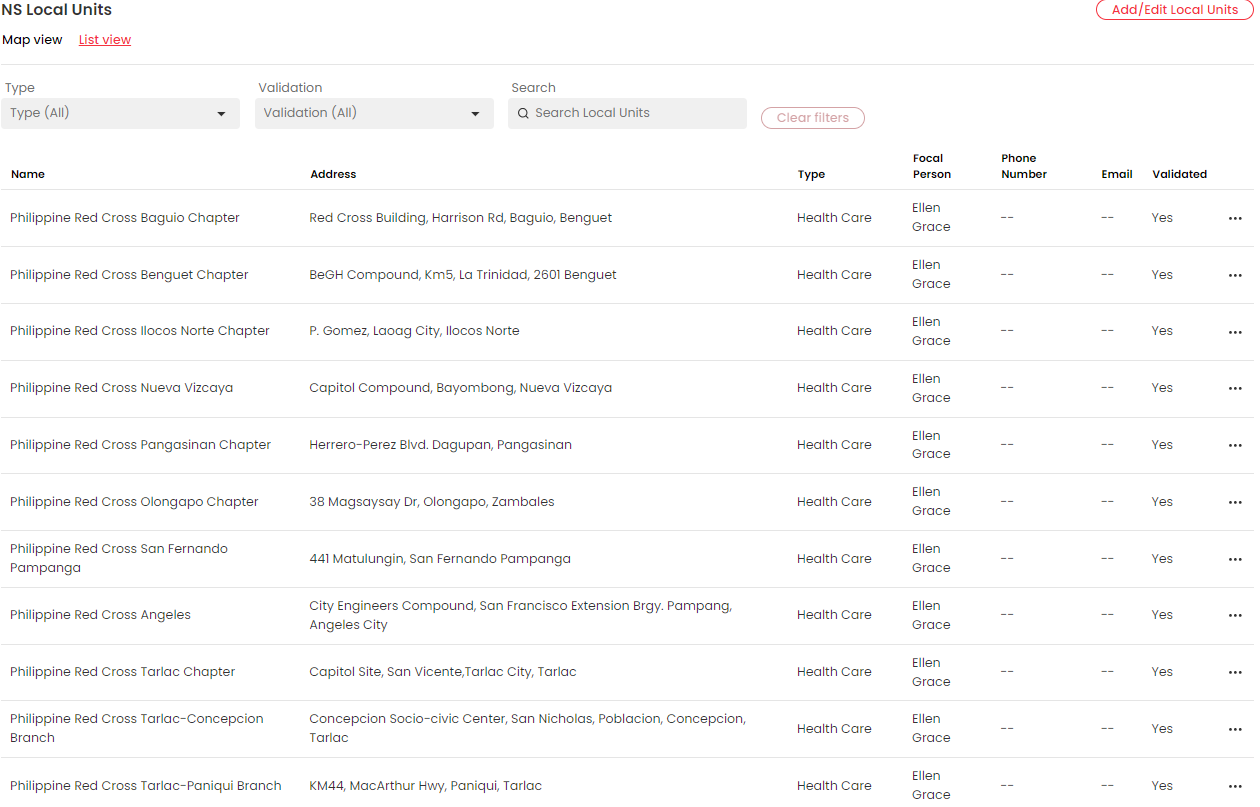
The platform comprises three main pages: Map View, List View, and Add Local Units. The Map View is the first page you will see, which serves as the primary page for local units. Additionally, the map provides options to filter and view more information through tooltips. The local units will be symbolized based on their six categories using icons adapted from OCHA and a legend on the bottom of the map. The List View page contains a comprehensive list of all the local units of that National Society, and the user on this page will have wider access to the local units data and an option to edit, add, delete, and validate the local units data. Above the map view there is a button to add local units, if clicked a form will pop up which will allow the logged-in user to fill it with added information and submit thereof.
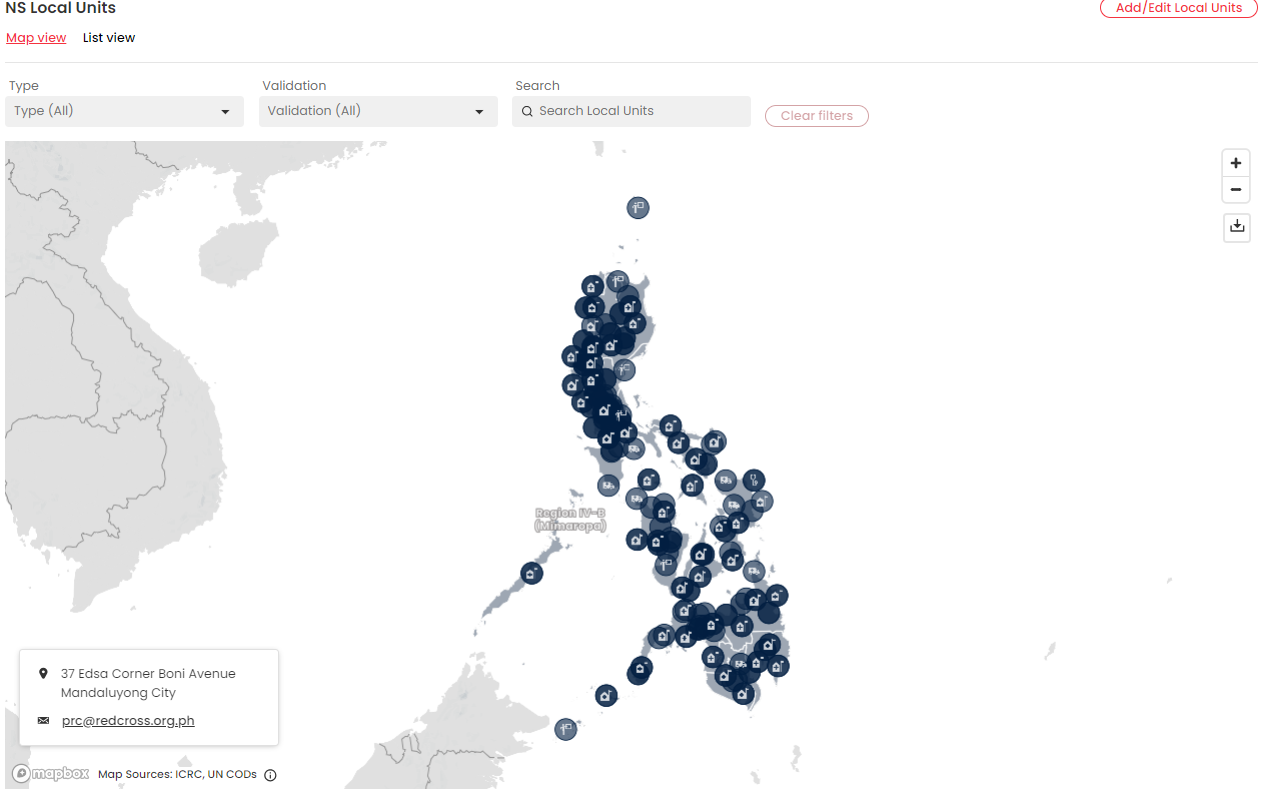
Administrative units cover branch offices, volunteer offices, and headquarters, etc.; healthcare units include hospitals, clinics, pharmacies, blood centers, and ambulances, etc.; emergency response covers cyclone centers, evacuation centers, first aid stations, search and rescue bases, emergency communication hubs, warehouses, etc.; humanitarian assistance centers cover temporary shelters, aid distribution centers, community resource centers, recovery and rehabilitation hubs, etc.; training and education cover facilities primarily used for training such as schools, first aid training centers, etc.; and Other covers units that do not belong to those categories but are key for the National Society, such as business hubs and shops.

Local Units Data:
The initial data for the local units comes from several initiatives by various parts of the movement that have taken some time to consolidate the data in the past. These include:
- SIMS Network: The SIMS network has been collecting information regarding local units through web scraping since 2017. This initiative resulted in 6000 points collected from various NS websites and other web sources.
- ICRC In-country Projects: The ICRC, through its in-country projects, has collected local unit data from various NSs. This initiative resulted in 2500 points collected but not validated by National Societies, which are the primary owners of these units.
- Professional Health Mapping: The Professional Health Services Mapping Project, led by the Health and Strategic Planning departments, has collected, and compiled more than 4000 data points on the crucial work of our National Societies in the field of clinical health, including facilities, services, and resources.
Modifying existing local unit information
Only on List View, users are granted the capability to edit existing local unit information by clicking the edit button. Upon clicking, a window will appear, displaying the current local unit data along with its corresponding location on the map. Users have the option to make edits to the existing information and even relocate the point on the map to its accurate position. By doing so, the data will be updated in the global dataset table for local units, and these changes will be immediately synchronized with the front-end user interface.
Validating existing local unit information
The list view will show if the information displayed has been validated. By validated meaning, the National Society agrees that the information shared on the platform is a true version of what is on the ground. Only NS GO Focal points and GO Country Admins can validate the information by clicking a validate toggle button. Initially, all data that is coming from the National Societies has already been validated but the new points that will be added will require that validation or in the future if we add local unit data that is not coming from National Societies.
¶ 4. National Society Income Over Time
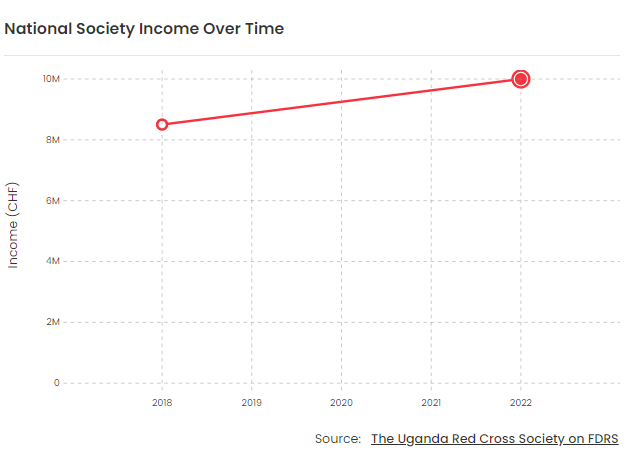
This section presents a line chart illustrating the income trends of the National Society over time, offering a visual representation of its financial performance. The breakdown is done over the years. The data is taken from the FDRS data bank's NS Source of Income and Expenditure over time section.
¶ 5. Income Source Breakdown
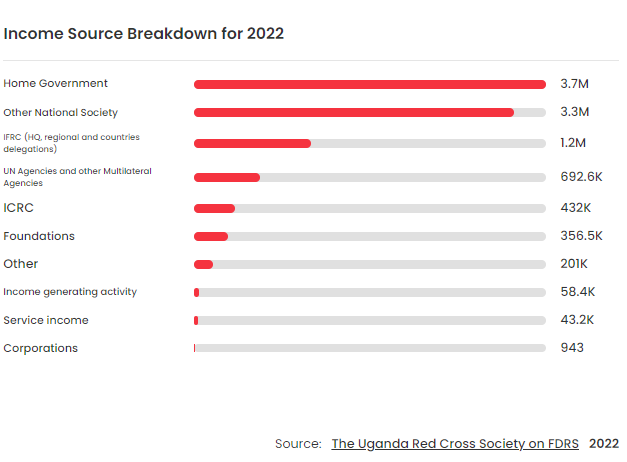
This section shows the information about the National Society income break down. The income breakdown is shown for last year. The data is taken from the FDRS data bank's NS Source of Income section. Upon hovering over the source it should show the description of what the income breakdown is as per FDRS.
¶ 6. NS Directory
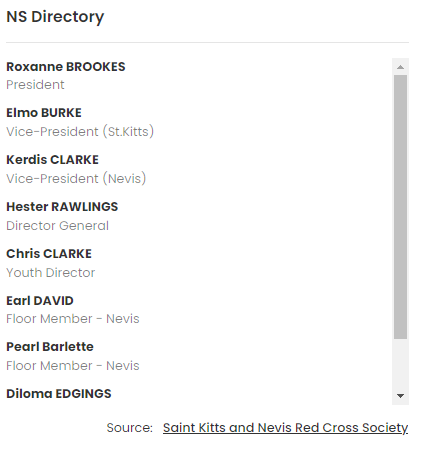
The NS Directory section given information (name and position) about the key contact persons of the National Society, for e.g. President, CEO, Secretary General, etc. This data is maintained by IFRC regions. If you notice outdated information, please report it to the respective regional IFRC office or send a note to ns.contactinformation@ifrc.org
¶ 7. NS Contacts
The information in this section displays the National Society contact points. The data can be entered, updated by the NS admin on the GO admin page (Country table)
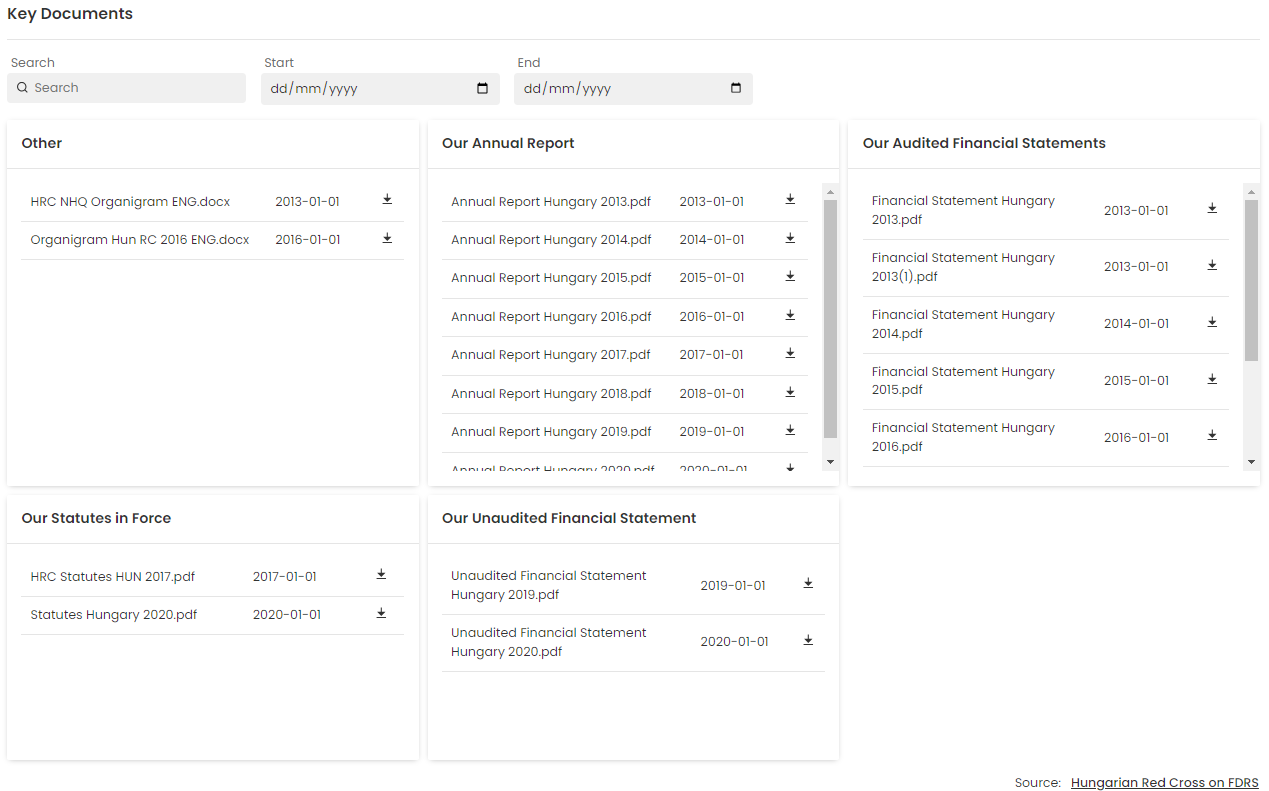
¶ 8. Key Documents
This section shows the National Society's documents from the previous year. It can contain documents like NS strategic plan or NS annual report etc. The data is imported from the FDRS data bank.
¶ Strategic Priorities
The data displayed in this section highlights the focus areas of the National Societies as per the IFRC unified plans and PER process. The displayed data is based on reporting and may not be fully indicative of all the priorities.
¶ 1. NS strategic priorities:
This section shows a tooltip with detailed information about the strategic priorities of the National Society as per the unified planning. It can also display the links of any strategic document of the National Society, IFRC or unified plan. Users can click on the button and the respective document will be opened in a tab of the browser.

¶ 2. Strengths & Key Development priorities (PER process)
This card shows the PER processes (components) strengths and weaknesses based on the latest year's data.

¶ Capacity
This section shows the various processes and assessments that the National Society has done with the IFRC that addresses the National Society development, capacity preparedness and others. On the right side of this section there is button named IFRC Evaluation database. Clicking upon this button directs the users to the respective sections of the evaluation database filtered already by the specific country.
¶ 1. Organizational Capacity Assessment
The purpose of this section is to show the capacity assessments that the National Society has done. This section displays two cards dealing with OPAC and BOCA assessments. OPAC and BOCA are NS and branch capacity assessments respectively. They both show the date of assessments and number of branches where assessments were performed.

¶ 2. NS Preparedness and Response Capacity
This section displays are the preparedness circles of the country. The National Society Preparedness for an Effective Response (PER) approach interacts with National Societies' processes in a structured way to contribute to their preparedness and response capacities. Clicking on the View button on the individual cards will open the PER details in a new window and users may need to use separate logins and need permissions to access that data.

- Information of Key Indicators: This card shows several indicators regarding the PER like PER cycle, Type of Assessment, PER phase etc. Clicking on the i icon next to each indicator will show the detailed information about each indicator.
- PER Assessment Results: The data is a generic result shown in the form of a pie chart coming from the PER reports. It shows the distribution of the ratings as per PER assessment from 0 (Not Reviewed) to 5 (High Performance). It also shows the average component rating for the specific National Society.
- Components by Area: The data is the global results showed with a diagram (bar chart) coming from PER reports. It shows the average rating in different assessment areas for the specific National Society.
- Previous PER Assessments: The average assessment ratings are displayed in the form of a chart for the last 2 to 3 years.
- Highlighted Top Rated Components: This section displays the top rated components for a National Society based on PER reports in the form of cards.
- Priority Component to be Strengthened: This section displays the components with low average PER ratings in the form of cards to highlight the components which requires improvement.
- Component Rating Results: The component titles are displayed along with their PER ratings sorted from the highest rated component to the lowest rated component. Non rated components are not displayed.
- Relevant Documents: This section displays all the relevant documents that have been used to locate the data on the page.
¶ Partners
This page contains info about the partners of the specific National Societies as well the activities and the strategic priorities where the partners are supporting the particular country.
¶ IFRC Presence
The information in this section contains the IFRC delegation contacts which are sourced from an existing contact database. It shows the contact information of the country delegation or the country office. On right hand side of the card, there are links which can direct the user to the IFRC legal status and disaster law websites, linking directly to the country pages. Logins may be required from the user to access those websites.

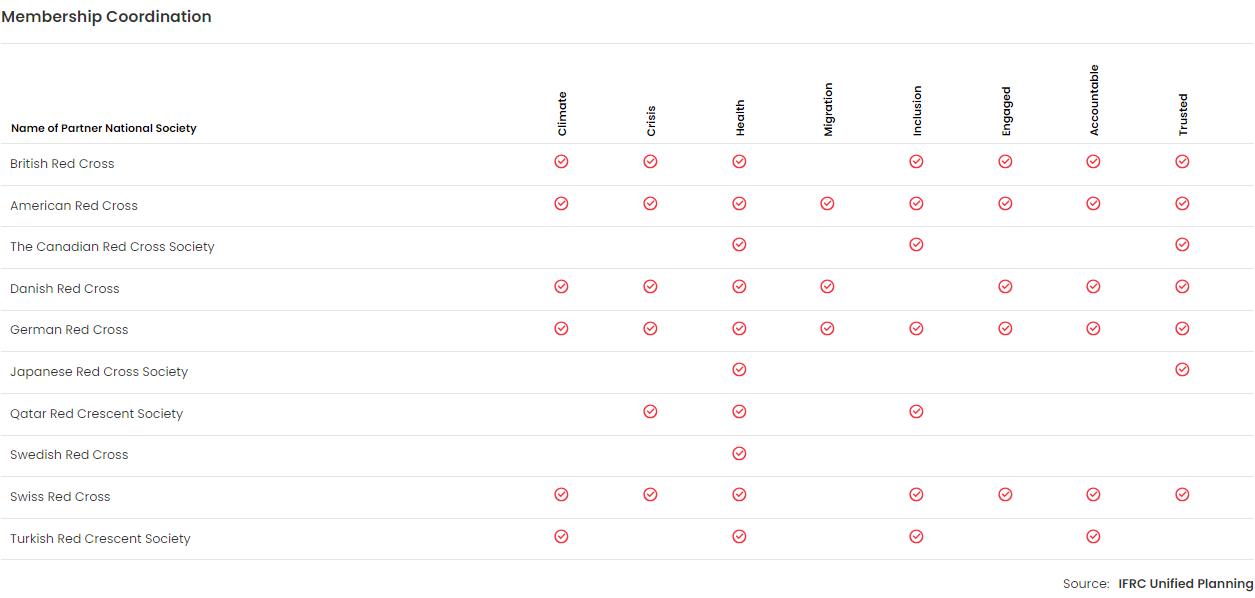
¶ 2. Membership Coordination
The data in this section is coming from the unified plan document of the IFRC. The partners submit data as per IFRC strategic priorities and enablers (e.g. climate etc.). The data is displayed in a tabular form. The checkmarks means that the partner is supporting this particular country on that strategic priority or enabler.
¶ 3. Contacts
The information displays the IFRC and international partners' contact points. The data is taken from FDRS data bank.
¶ Country Profile
The country profile section provides a comprehensive overview of socio-economic and demographic factors, offering a snapshot about the country. It delves into vital statistics and trends, shedding light on key indicators crucial for understanding the country's dynamics. Through streamlined presentation, this section facilitates a comprehensive grasp of socio-economic landscape, seasonal patterns, and disaster preparedness of the country. Additionally, it includes forecasted disasters and models the potential impact of natural disasters, enhancing its utility for disaster preparedness and risk management.
¶ Overview
This page provides an overview of the country with its socio-economic, demographic and climatic information.
¶ 1. Country Key Indicators
This section shows the key socio-economic indicators of the country like population, GDP, poverty, literacy, gender inequality index etc.

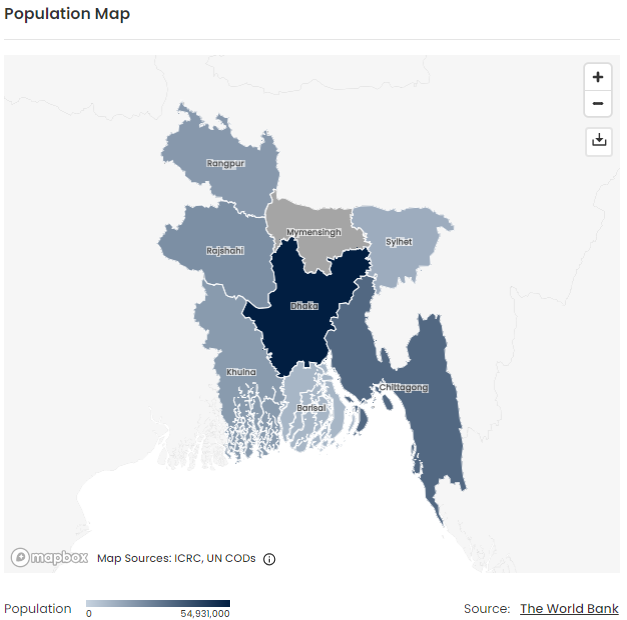
¶ 2. Population Map
This section shows the map of the country with marked areas showing the level/ density of population.
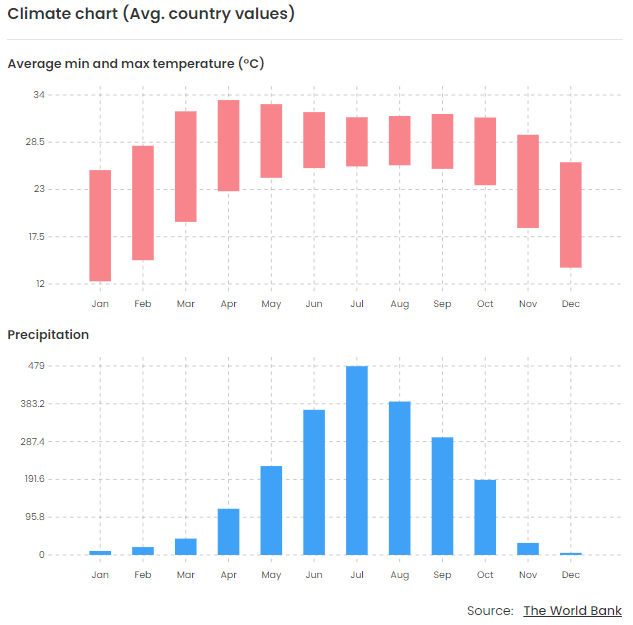
¶ 3. Climate Charts
The data of minimum and maximum temperatures as well as precipitation over months is displayed in the form of charts.
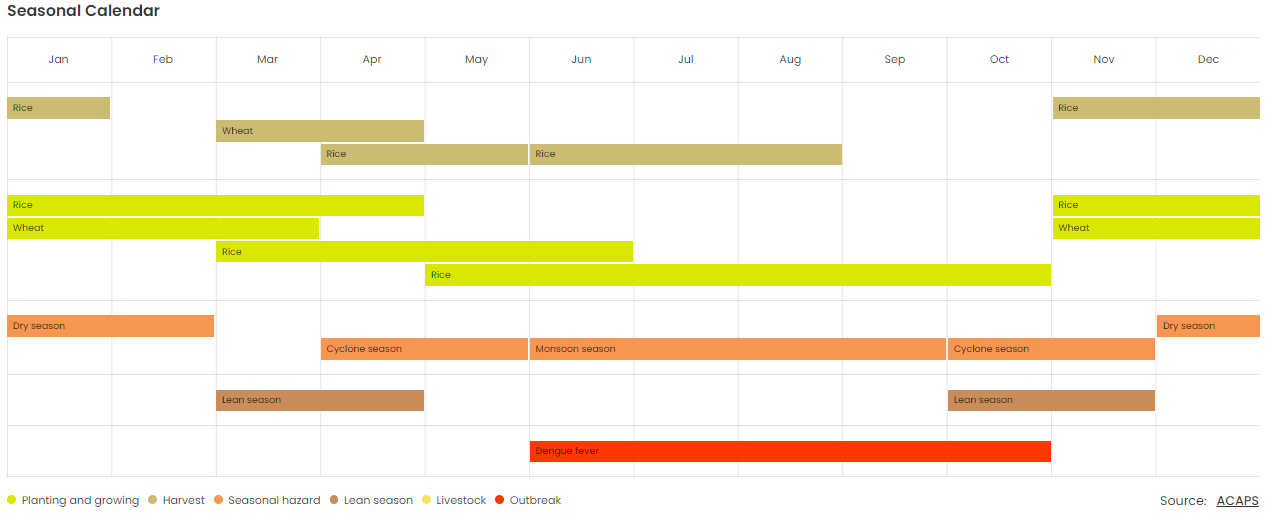
¶ 4. Seasonal Calendar
The seasonal calendar visually encapsulates significant climate-related events, agricultural planning , and the occurrence of natural disasters through a intuitive chart. Each event is meticulously charted, spanning across months to depict its duration and timing throughout the year. This graphical representation offers a clear and concise overview, facilitating informed decision-making and strategic planning for the National Societies.
¶ Risk Watch
This page provides information about the modelled impacts of the specific forecasted or detected natural hazards.
¶ 1. Map of Imminent Events
The imminent events tab displays that are going to start or have started but have not turned into an emergency. The events are displayed on the map of specific region of the country where they will occur. Hovering over the event will show the trajectory/ cone, while clicking on it will show the event details.
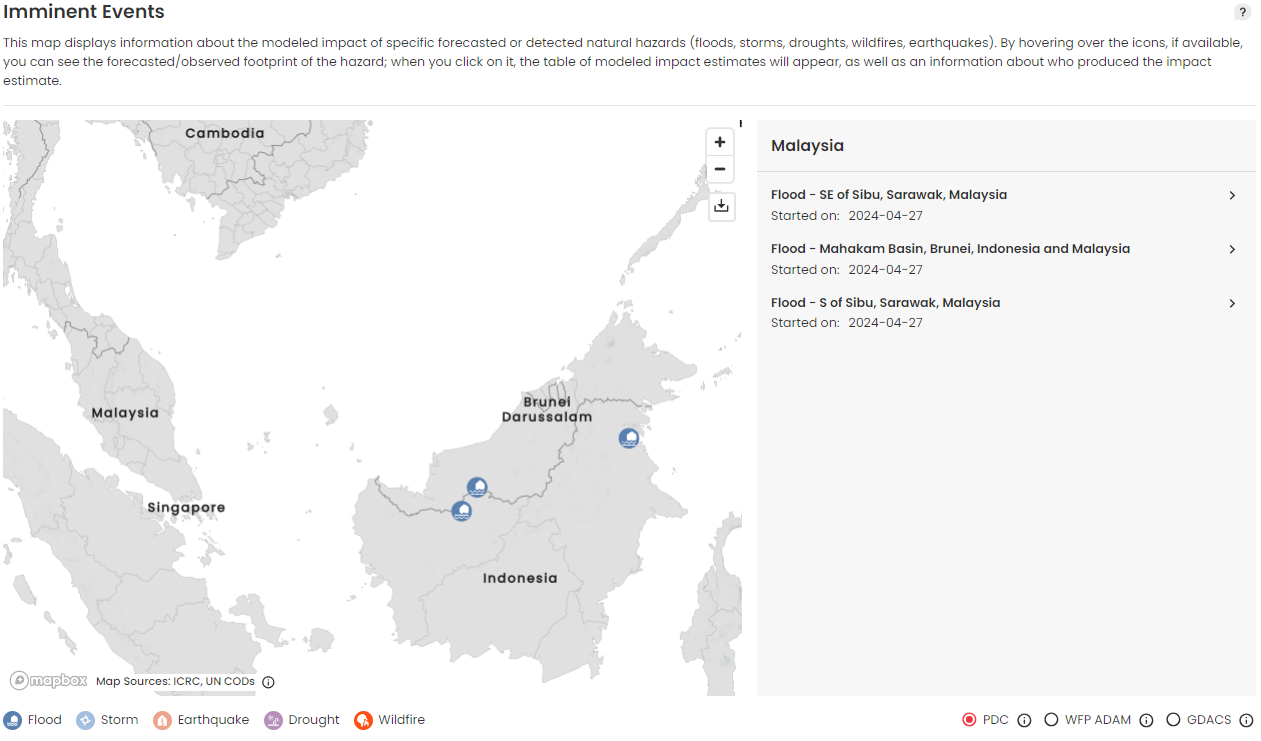
When an imminent event is clicked either from the map or from the sidebar, the sidebar will expand accordingly displaying detailed information about the event. The following components become visible upon expanding the event:
- Sources Tabs: As the information greatly varies for each source, each of them will have a dedicated tab with relevant information displayed once the event is selected. Four sources are used to display information about the forecasted imminent event namely PDS (Pacific Disaster Centre), WFP ADAM (World Food Programme - Automatic Disaster Analysis and Mapping), GDACS (Global Disaster Alert and Coordination System) and MeteoSwiss.
- Dates: The creation and updating dates of the event are show here.
- Key numbers: Each source has some key data about the impact to display which is visualized is this section. The numbers are highlighted and secondary information (e.g. return periods) are de-highlighted for visual hierarchy. For example number of people affected, households exposed, value (USD) of exposed buildings etc.
- Previous similar event: A link to a previous most similar event is visible here, which is also linked to the GO emergency page as available.
- Details: Any available details, additional links and additional information from the sources is displayed here.
- Previous events: For country, a link to the previous event should take the user to the next tab.
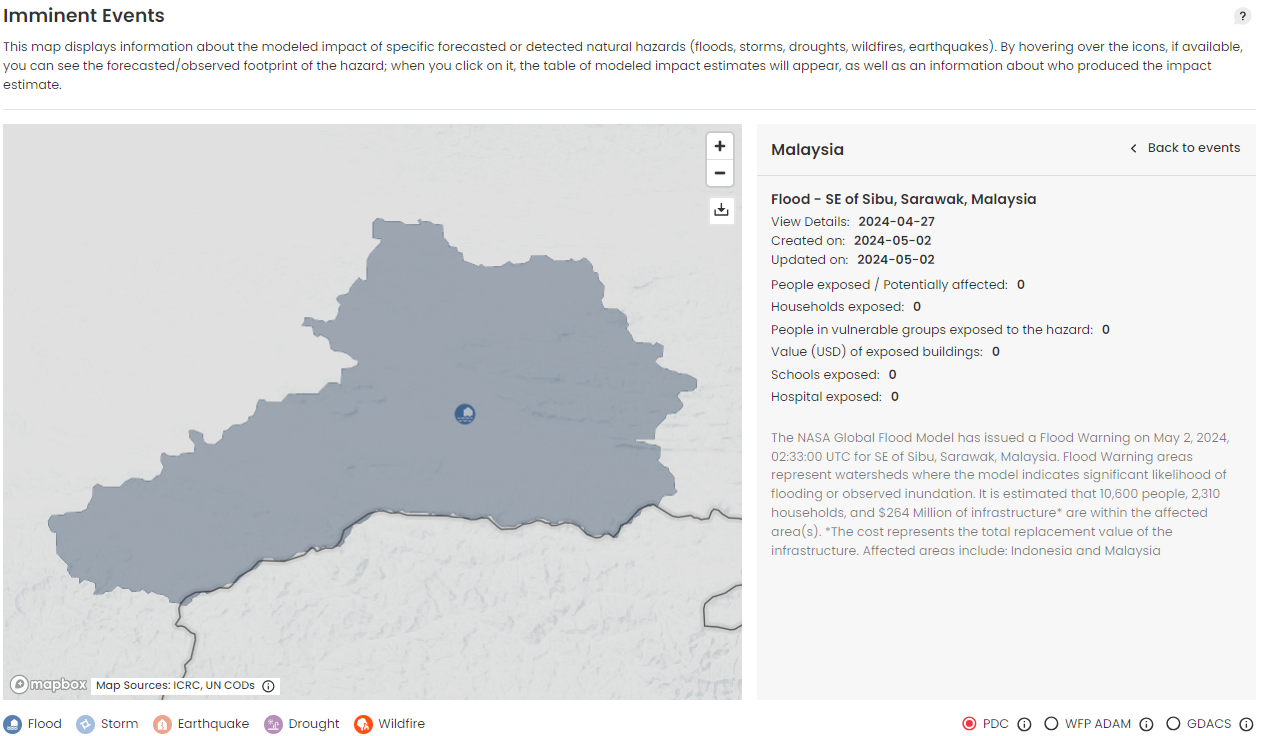
¶ 2. Risks by Month
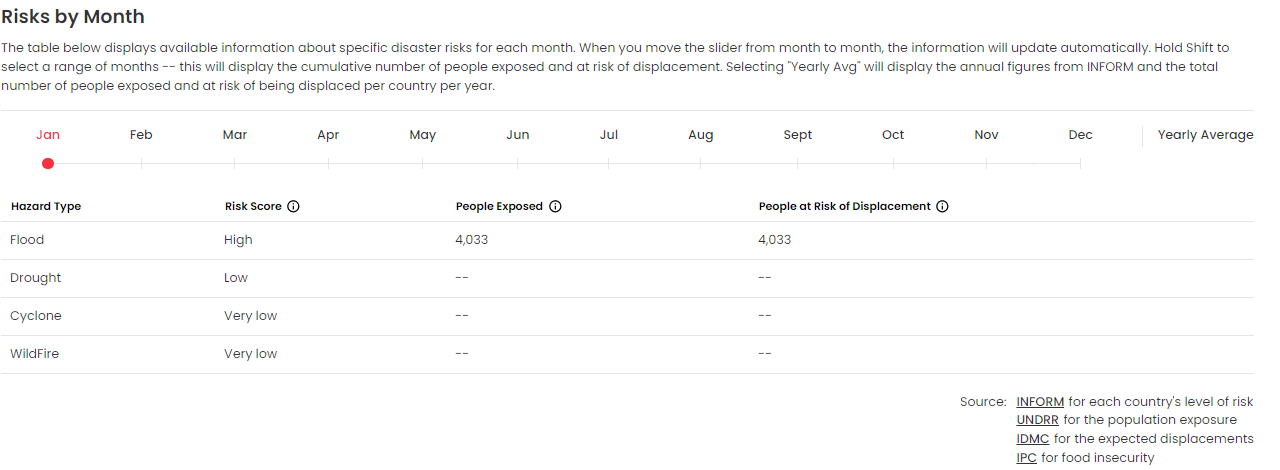
This table shows the disaster risk for each month. The information is updated automatically upon moving the slider. Clicking on the Yearly Average button will show the INFORM Risk Score for every disaster and the number of people affected (exposed and people at risk of displacement). The title (for e.g. Philippines) will update depending on whether it is country page, country province or a regional page.
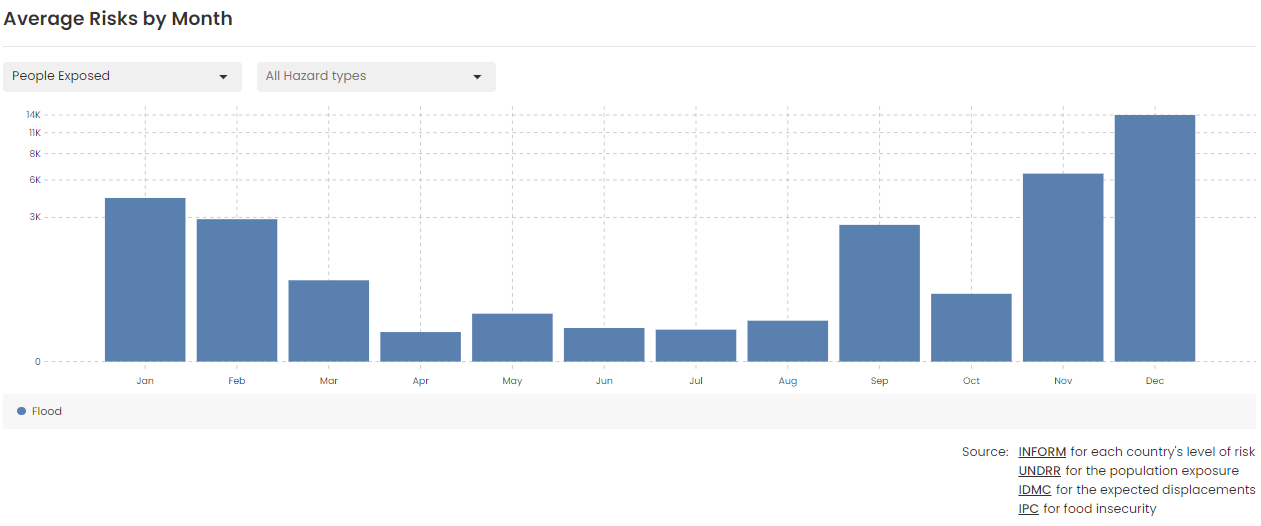
¶ 3. Average Risks by Months
The diagram under this section displays the average number of people that are affected ranging over all the months over an year. The diagram displays the data of the current year. The average number of people affected is also broken down by the disaster type.
¶ 4. Expected Return Periods
The table displays prediction per particular period. The data is collected based on previous events. It shows likely future human and economic impacts that can be caused by a disaster.

¶ Previous Events
This page contains information about the previous events that have occurred in the country and the information can be filtered down to the last 10 years.
¶ 1. Key Indicators
This section displays the key indicators about the previous disasters like Total Emergencies, number of emergency Appeals and DREFs, Targeted Population, Funding Requirements etc.

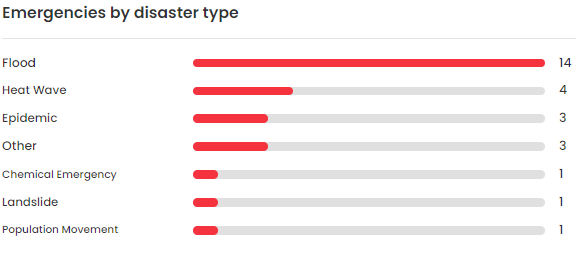
¶ 2. Emergencies by Type
The data for number of emergencies differentiated by types for a particular country is displayed in this section in the form of a chart.
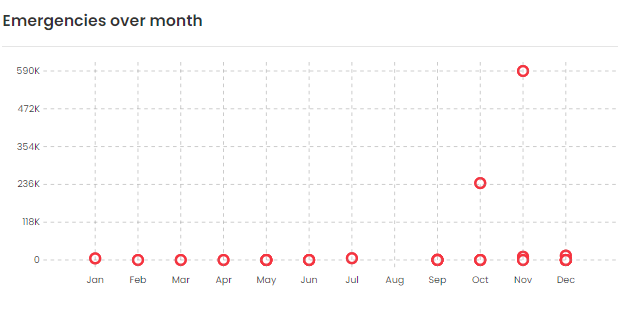
¶ 3. Emergencies over Months
The diagram displays the emergencies over the months and the number of people that have been affected by the emergencies. The chart collects information for all the previous emergencies.
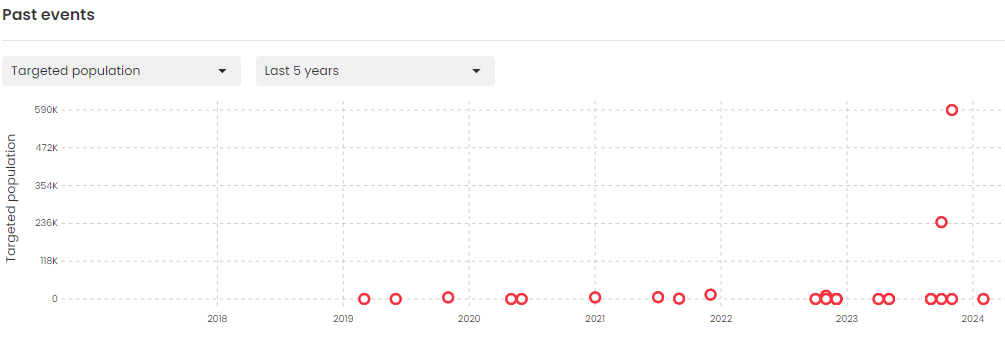
¶ 4. Past Events (Previous Events Timeline)
The chart displays the information of all the previous events occurring in a country. The data can be filtered for the last 5 or 10 years.
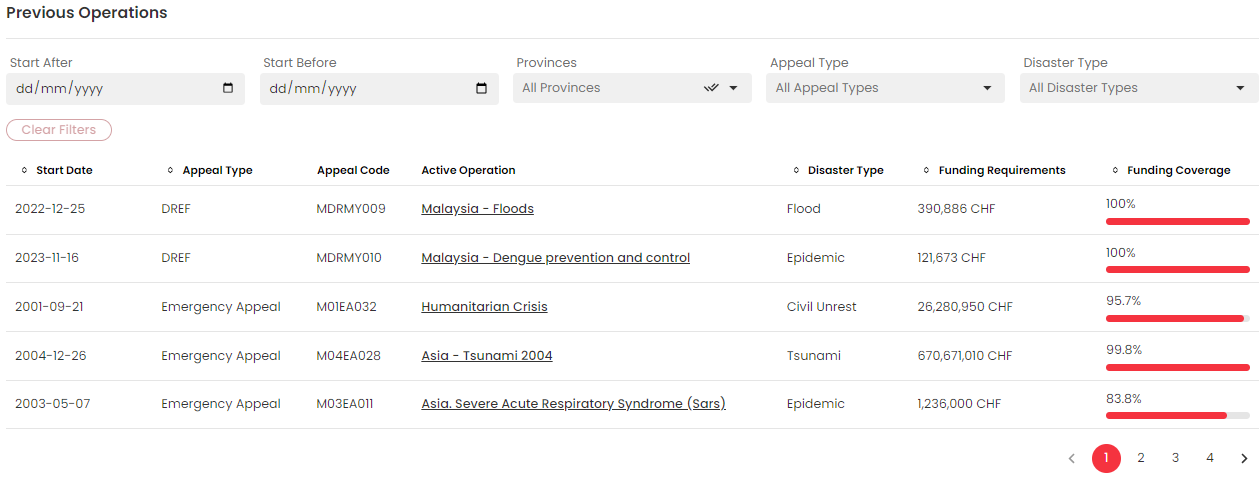
¶ 5 Previous Operations
The list displays the information of all the previous events occurring in a country in a tabular view. The data is sorted and presented from latest to the oldest emergency.
¶ Additional Data
The purpose of this section is to add any additional data that the National Society may find relevant, which has not surfaced on any other tabs. Users with relevant access rights can edit this section by clicking the edit button on the right.