¶ Purpose:
We use Mapbox to host base maps that are used on Go and available for any mapping application across the Movement. The Purpose is to provide consistent styling that also meets the IFRC standards for country names and boundaries.
The IFRC Mapbox basemap can be used in other applications to add additional data on top, for example in web maps, PowerBI and Tableau. The basic information you will need for any application is the style URL and token:
Style URLs:
Main: mapbox://styles/go-ifrc/ckrfe16ru4c8718phmckdfjh0
WMTS:https://api.mapbox.com/styles/v1/go-ifrc/ckrfe16ru4c8718phmckdfjh0/wmts?. WMTS stands for Web Map Tile Service. It is a standard protocol for serving image-based map tiles over the internet. WMTS is a popular way to add custom maps to from third-party services to GIS software like ArcMap and QGIS.
Tableau:https://api.mapbox.com/styles/v1/go-ifrc/ckrfe16ru4c8718phmckdfjh0.html?title=true&access_token=pk.eyJ1IjoiZ28taWZyYyIsImEiOiJjamlybHUzNmMwZDUxM3Fwa215YjJ1dzk5In0.OhqEybDX303sHjHzq3nFYQ#1.9/14.694911/14.129731/0
Access Token: Contact the IM team sharing your use case at im@ifrc.org
¶ IFRC Basemap Style:
There are many tilesets available on the IFRC Mapbox account. However, there is currently one managed style that is kept up to date with the data on GO for country (admin 0) and district (admin 1). By styling across zoom levels, the aim is that one style meets all use cases. Explore the style below or you can use this preview link to view in full screen.
Note: County labels do not appear until zoom level1 (z1) is used to simplify the map, the map when viewed at a global scale.
¶ Style Updates
The style will be frequently updated and any application using the styles will automatically reflect any changes. The main reasons for the changes are:
- Updates to the data on GO - e.g. country name or admin 1 boundaries.
- Bugs or style improvements - e.g. making borders clearer
- Adding new features - e.g. waterways, cities, roads
Updates to the style will be drafted and the preview link shared on SIMS Slack and emailed to the Mapbox user group. Users will then have an opportunity to give feedback on the style changes before they are pushed live.
If you have any feedback or suggestions to improve the style, please email im@ifrc.org.
¶ Tileset Data
Tilesets are the name used for datasets in Mapbox that are used to build the style. These include the data exported from GO, added from ICRC and from other sources such as OpenStreetMap.
You will need more details about the Tilesets to be able to link to the data in Mapbox. For example, you might want to join your data to the Mapbox countries in order to create a choropleth map in Power BI.
Countries and districts are imported directly from GO. You can access the latest data from the API with the following link and view the data dictionary of the fields:
| Mapbox name | Tileset ID | Type | Data | Details |
|---|---|---|---|---|
| GO Countries | go-ifrc.go-countries | Polygon | Download | Data Dictionary |
| GO Districts | go-ifrc.go-county-centroids | Polygon | Download | Data Dictionary |
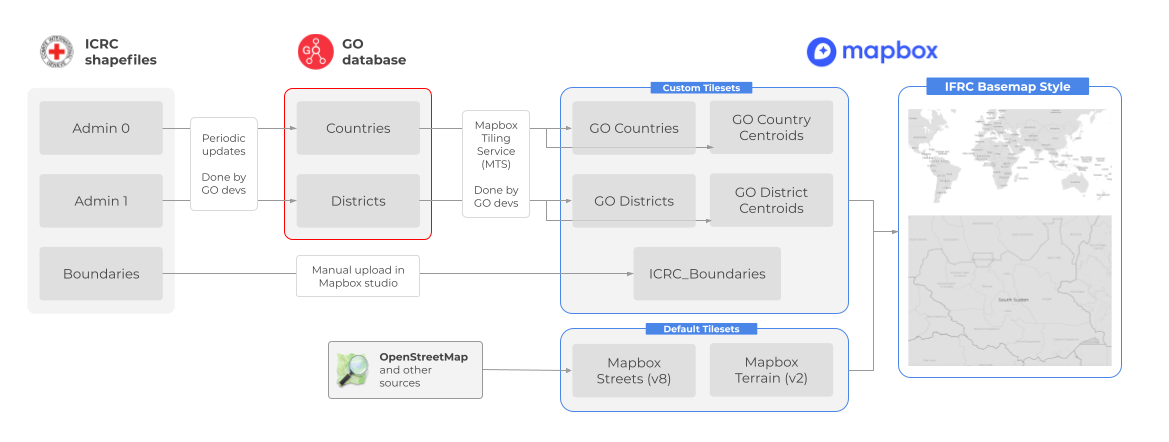
¶ Setup
The diagram below shows the data flow and processes from source files, to GO and then to Mapobox.
¶ Using Power BI with Mapbox
It is very easy to create Mpbox-powered interactive and dynamic visualizations in Power BI. In order to add IFRC basemap to your visual in Power BI it is necessary to first download the Mapbox Custom Visual plugin for Power BI which is built and maintained by Starschema. It is an easy way to add map visualization in any Power BI report. To download the mapbox plugin users can refere to the Step 1 in the step by step guide of building maps using mapbox.
Users can create different maps like heat maps, graduated circles, clusters and even 3D extrusions with data driven colouring.
The data and Power BI file can be accessed here.
¶ Making a map with IFRC tileset in Mapbox
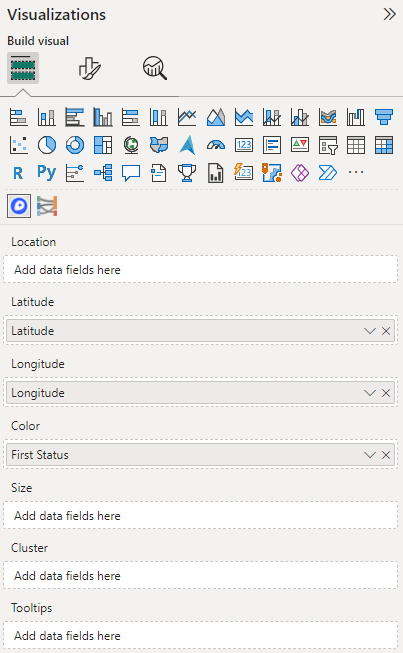
- After the users have added the mapbox plugin in Power BI, double click on the Mapbox icon under visuals to add it to the report pane.
- Either the users can drag and drop the Latitude and Longitude fields from the dataset into the appropriate fields of the mapbox visual or add appropriate data into the Location field.
- Location field is to add other forms of location data, such as place names or custom location IDs.
- Add appropriate data in the color field for visualization.
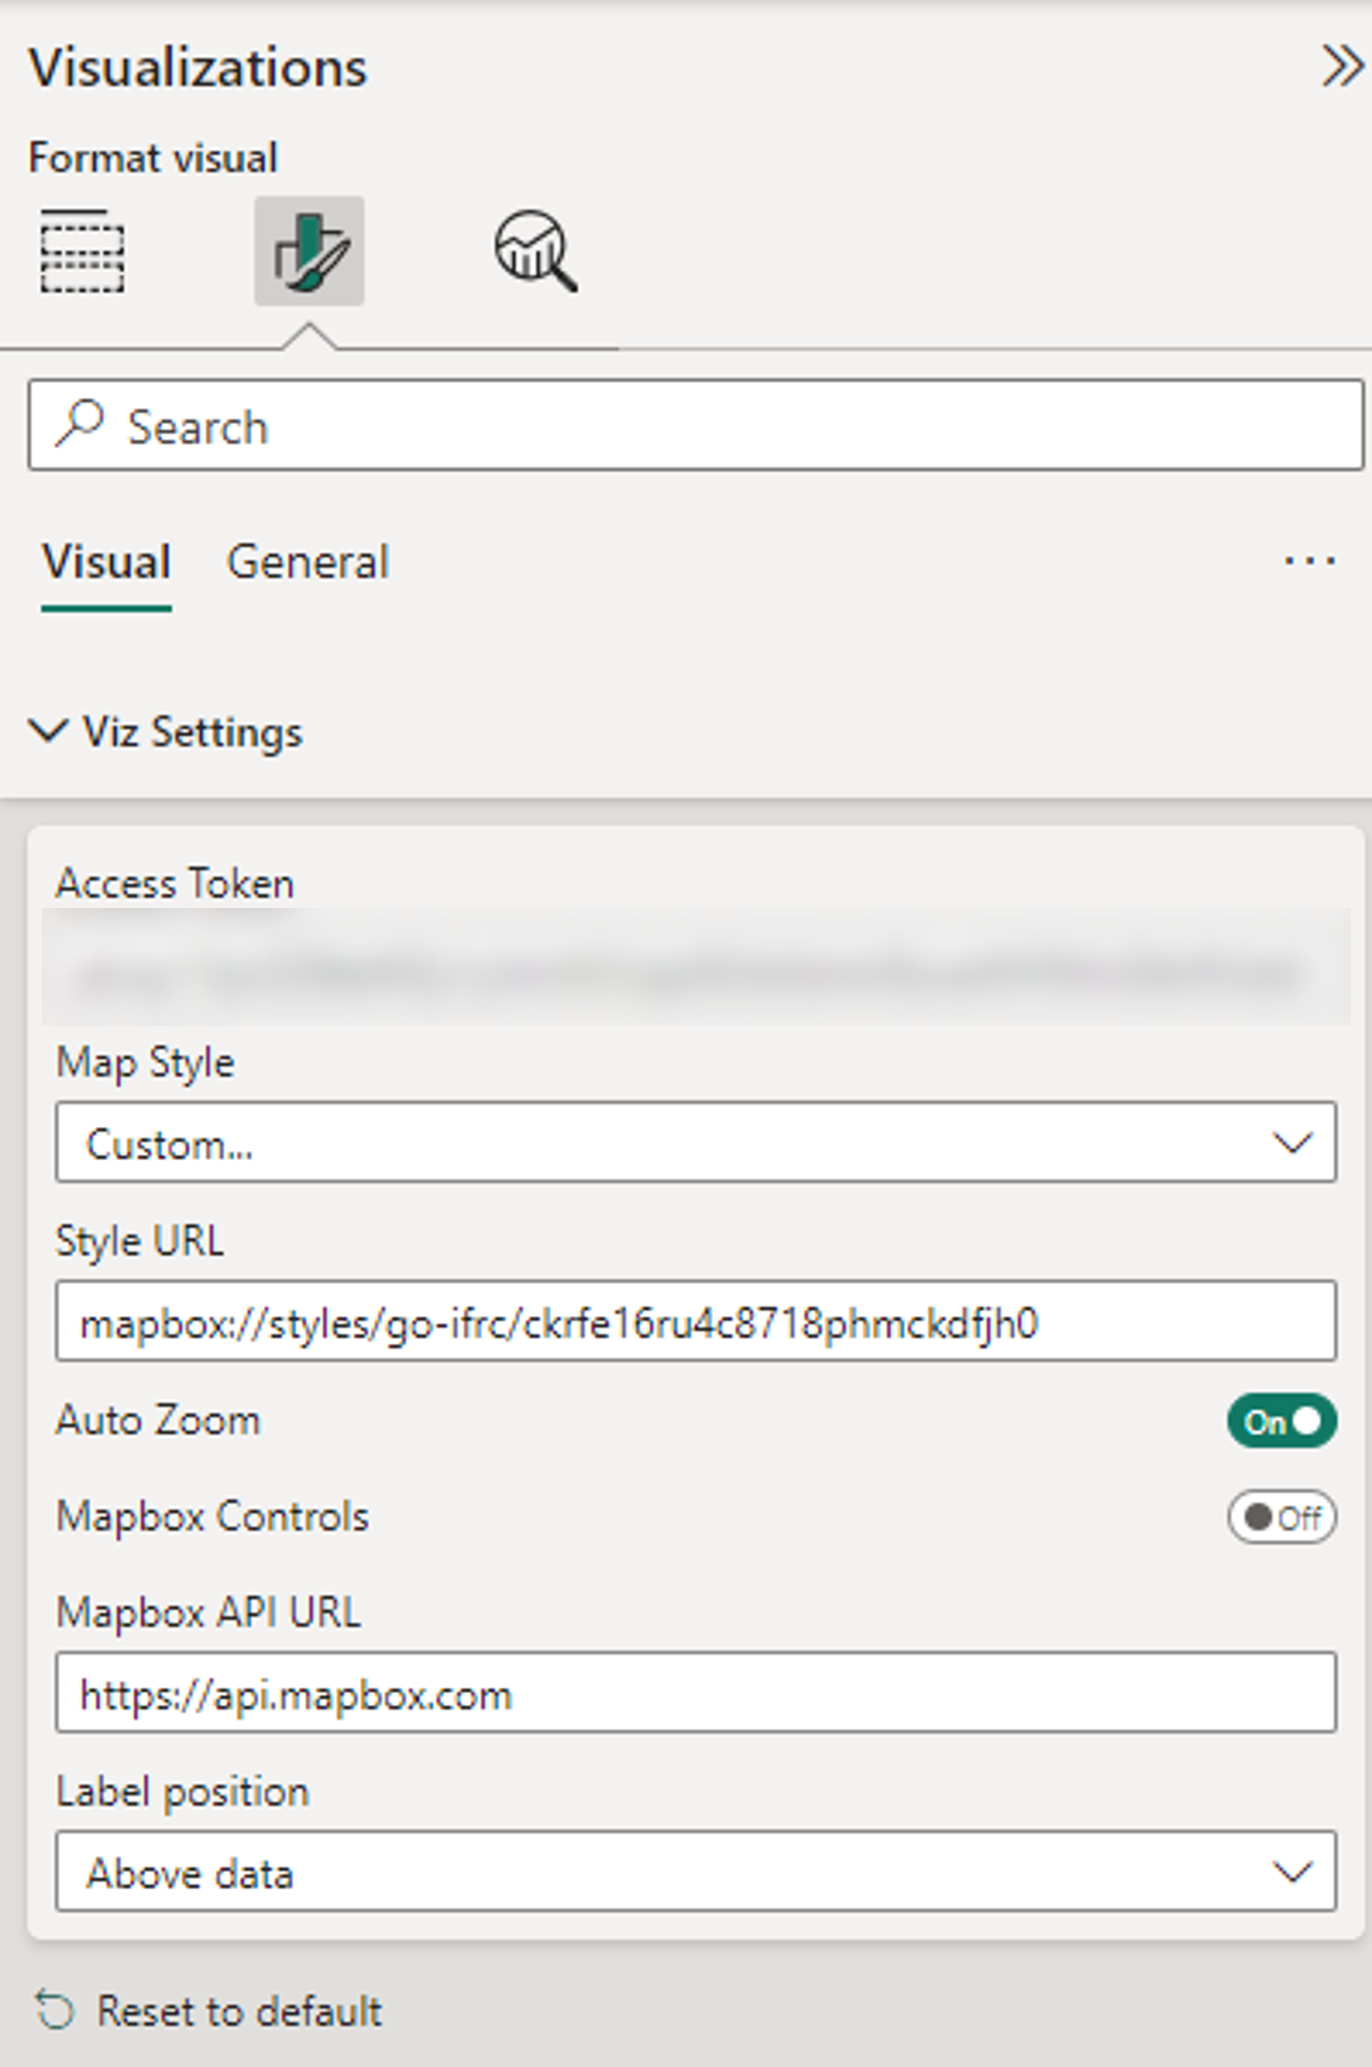
- Next, go to the Format your visual option under the Build visual and click on Viz Settings to expand it.
- Paste the Access Token and Mapbox style URL in the appropriate fields.
- To be able to see the style URL field, select Custom... in the Map style.
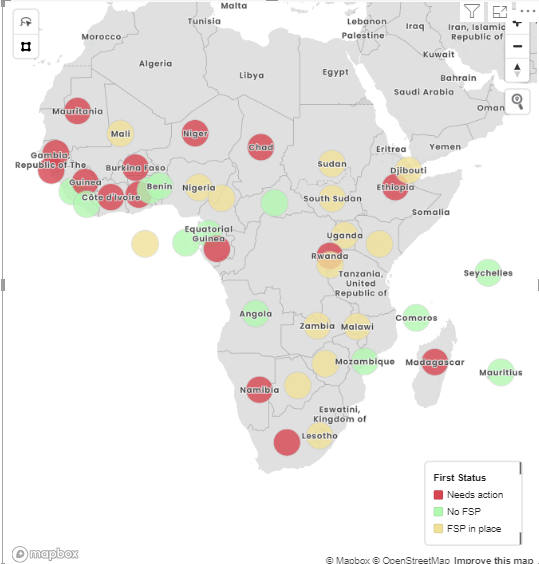
- The visual in the report should look like below, with the longitude and latitudes along with the FSP status of the country.
- The visual shows circles because by default circles option is selected in the Format visual option.
- Users can also build choropleth maps, or any other type of visuals. To build choropleth maps location information is required.
- Users can refer to the page Maps in Power BI & Python for a detailed step by step guide on building choropleth maps using IFRC tileset in Power BI & python. The data for constructing these maps is obtained from GO - API