To run the python code in an interactive environment users can run the python code shared here in the form of Jupyter notebooks on Binder. Please click on the following link: Run Notebooks on Binder
¶ Sample API Query: Projects per Sector
In this Sample API query we will be accessing the data from the Projects API endpoint using PowerBI/ Excel and python and visualize the number of projects per sector in Nepal.
¶ API Endpoint
The API endpoint can be accessed by building a URL query in PowerBI or Microsoft Excel. In this example we will be accessing the data from the Projects API endpoint and parameter Country to Nepal. In order to access Projects in a specific country, you need to write the associated 3 letter ISO3 code (specifically, the Alpha-3 code). The ISO3 code is case sensitive.
So our URL for this specific search would look like this:
https://goadmin.ifrc.org/api/v2/project/?country_iso3=NPL
- Here
https://goadmin.ifrc.org/api/tells PowerBI (or any other service/tool referencing the API) to connect with the GO server. All of your API calls to GO will start with this as a base URL. - The
v2/project/refers to the latest version of the API. There are multiple data tables within the database and project tells GO to search for the table that stores projects data ( as opposed to , say appeals, or the deployments. Seehttps://goadmin.ifrc.org/api-docs/swagger-ui/to see a full list of the available API endpoints. - The
country_iso3=NPLis the parameter that has been used to filter the projects in Nepal.
Since the data is coming from a paginated API, we will be utilizing the method used on the Pagination page along with the authorization token.
¶ Using PowerBI/ Excel
- Select Transform data from the top ribbon to open the Power query editor.
- We define a parameters table which contains the Authorization token and country parameters that will be used in querying the data. We can construct a table by clicking on the Enter Data option under the Home ribbon and write the authorization code and 3 letter ISO3 code
NPLfor Nepal. - Click OK and a new query will be generated under the Queries window. Lets rename this query to Parameters.
- Under the Home ribbon, from New Source, select Blank Query. Click on Advance editor, this will open the advance query editing dialog box. Advance editor uses the m language to edit the query. In the advance editor window, paste the following code:
let
    // Get the parameter values
    ParametersTable = Parameters,
    Token = Table.SelectRows(ParametersTable, each [Column1] = "Token"){0}[Column2],

    country_from = Table.SelectRows(ParametersTable, each [Column1] = "country_from"){0}[Column2],


    BaseUrl = "https://goadmin.ifrc.org",
    PageSize = 50,  // Number of items per page

    // Construct the query options based on parameter values
    queryOptions =

        [
            country_iso3 = if country_from <> null then Text.From(country_from) else "",
            limit = Text.From(PageSize),
            offset = "0"  // Set initial offset to 0 as a string
        ],


    GetPage = (offset) =>
        let
            Url = BaseUrl,
            Headers = if Token <> null then [#"Accept-Language"="en", #"Authorization"="Token " & Token] else [#"Accept-Language"="en"],
            Response = Json.Document(Web.Contents(Url, [Headers=Headers, RelativePath = "api/v2/project/", Query=queryOptions & [offset = Text.From(offset)]])),
            Results = Response[results]
        in
            Results,

    CombineAllPages = List.Generate(
        () => [Offset = 0],
        each let page = GetPage([Offset]) in page <> null and List.Count(page) > 0,
        each [Offset = [Offset] + PageSize],
        each GetPage([Offset])
    ),


    #"Converted to Table" = Table.FromList(CombineAllPages, Splitter.SplitByNothing(), null, null, ExtraValues.Error),
    #"Expanded Column1" = Table.ExpandListColumn(#"Converted to Table", "Column1")
in
    #"Expanded Column1"
If you want to search/ query the data for more than one country, you can add the iso3 codes of the country in the parameters table separated by a comma. You can also specify the country iso3 codes and authentication token directly in the M code without making the parameters table as follows:
Token = "your authetication token"

country_from = "IND,NPL,HUN" // in case you want to retrieve the data for Nepal, India and Hungary
- n the code above the Token and country variables derive their values from the Parameters table that was constructed in the previous steps.
- The number of records on every page are stored in the PageSize variable. Since each API page contains 50 records, set this variable to 50.
- The
queryOptionsvariable in this code is constructing the filter query parameter that will be appended to the API URL to filter the results. It is checking if the country parameter values are null or not, and constructing different filter values based on that. ThequeryOptionsfilter allows the query to the API to be customized based on the input parameters, to filter the results returned from the API. - The
GetPagefunction is responsible for constructing the full API URL for a specific page, making the API request based on the parameters used, parsing the response and returning just the array of results for that page.
In this M code we have used the RelativePath and Query options with WebContents() function and passed the first parameter of the function as a static string. This has been done so that there is no problem when a published dataset is refreshed. PowerBI does some static analysis on the code to determine what data sources have been used and whether the supplied credentials are correct. Unfortunately in some cases, the definition of a data source depends on the parameters from a custom M function, that static analysis can fail and therefore the dataset does not refresh.Therefore, the following expression has to be used when constructing the query in PowerBI or excel:
Web.Contents(Url, [Headers=Headers, RelativePath = "api/v2/project/", Query=queryOptions & [offset = Text.From(offset)]])
- The
CombineAllPagesfunction is responsible for looping through all available pages of results from the API and combining them into a single list. It loops through all the available pages by incrementing the offset counter with PageSize. It callsGetPageto fetch each API page, stops when theGetPagereturn 0 and accumulates all the results into a single list. - After the code has been pasted in the advance editor window, click on done. A series of steps will be added in the APPLIED STEPS on the right side of the query editor window. If the APPLIED STEPS are not visible click on Query Settings under the View ribbon.
- After that we need to expand the data and select the necessary features/ columns. We can do this by clicking on the icon next to the name of the column.
- At the moment we will select only a few columns namely: primary_sector_display, secondary_sectors_display, operation_type_display and programme_type_display.
- Now we’re able to see what data this query is actually providing us! We’re ready to start building our visuals, so click Close and Apply at the top of your Power Query Editor window.
¶ Visualization in Power BI
There are three icons that appear on the far left of the screen namely:
- Report Icon: The "Report" icon is where you create and design interactive visual reports. In this section, you can build visualizations, charts, and dashboards to present your data in a meaningful way for analysis and sharing with others.
- Data Icon: The "Data" icon allows you to access and transform your data before creating visualizations. Here, you can connect to various data sources, perform data modeling, cleansing, and shaping tasks to prepare your data for analysis in Power BI.
- Model Icon: The "Model" icon represents the data modeling aspect of Power BI. In this section, you can define relationships between tables, create calculated columns, and build data models that serve as the foundation for creating meaningful visualizations and reports.
- To build visualizations select the Report icon. On the right side of the window you will see three sections namely: Filters, Visualizations and Fields. If they are collapsed, you can use the arrow to expand them. For this section we will be using the bar charts for visualizing the projects distributed in primary sectors in Nepal.
- After clicking on the appropriate chart type, a blank place holder will appear in the preview pane. To show data on the chart, you will need to drag the relevant fields from the right pane in to the X-axis and Y-axis.
- From the data tab select the table which has the data of the projects and scroll to find the field primary_sector_display. Drag it to both the X and Y axis. Power BI is smart enough to understand what we are doing so it will automatically count the frequency of projects in different sectors. it counts the frequency of each unique value that appears and generates the bar chart.
- The Bar chart can be customized, for example by changing the name and sizes of the axis and the title. The following bar chart would be obtained if the above steps are followed:
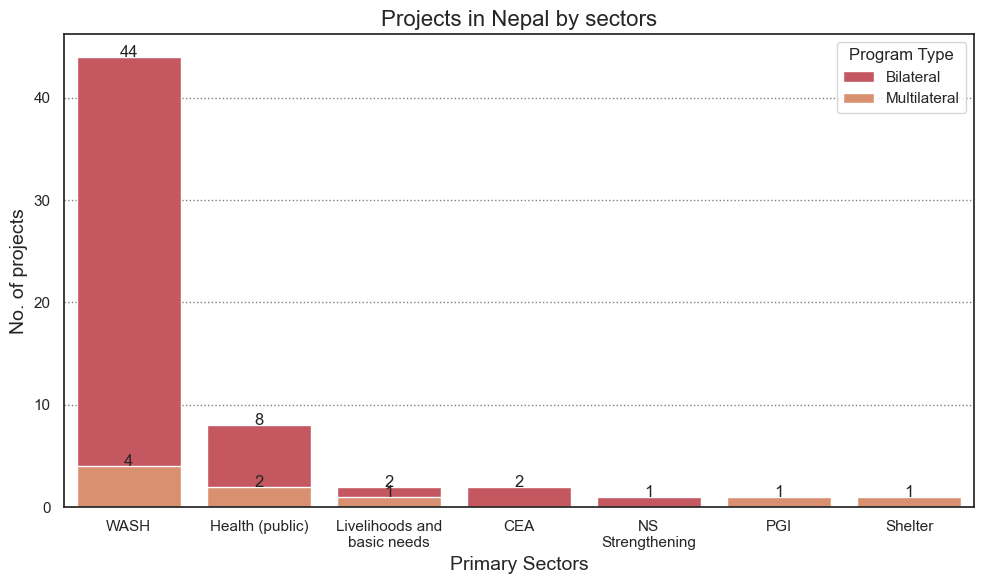
We can also change the visualization and select horizontal or vertical bar charts. We can also select stacked bar charts. In this case we can also drag another column/ field like programme_type into the legends field and visualize the projects in different sectors as per the programme type (bilateral or multilateral) (see below).
¶ Using Python
In this section, we will show how the data can be received from the Project API endpoint using python. Using the country parameter we will retrieve the Projects data for Nepal. We will be using Jupyter notebooks to implement the python code. Jupyter notebooks is a open source tool used for interactive computing, data analysis, data visualizing and machine learning. They provide an interactive cloud base interface that allows the users to create and share documents with code, equations, visualizations and text.
To access the data in python, the following libraries have to be imported.
requests:For sending the HTTP request to the API endpoint.collections:Provides specialized container data types that are alternatives to the built in data types like lists, tuples and dictionaries. These data types are more efficient and come with additional methods making your code more readable.matplotlib.pyplot:Used for creating static and animated visuals in python.numpy:Used for handling large and multidimensional arrays, thus facilitating data analysis.
import requests
from collections import Counter
import matplotlib.pyplot as plt
import pandas as pd
import seaborn as sns
import textwrapNow we will define a helper function named fetchProjects to query the API endpoint using requests library to retrieve a list of projects from a specific country. It construct a specific API requests with the specified country name, pagination parameters, and an authorization token. The function continues to make API requests until all the projects from the specified country have been retrieved. The fetched projects are accumulated in a list called all_results and then returned as a final output of the function.
def fetchProjects(country_iso3):
    base_url = "https://goadmin.ifrc.org/api/v2/project/"
    offset = 0
    page_size = 50
    all_results = []
    auth_token = "Your authorization token"

    while True:
        params = {"country_iso3": country_iso3, "offset": offset, "limit": page_size}

        headers = {
            "Authorization": f"Token {auth_token}"
            # Add other headers if needed
        }

        response = requests.get(base_url, params=params, headers=headers)
        data = response.json()
        projects = data.get("results", [])

        if not projects:
            # No more results, break the loop
            break

        # Add fetched projects to the results list
        all_results.extend(projects)

        # Increment offset for the next page
        offset += page_size

return all_resultsNext we define another function named getDataFromProjects which takes a list of projects as an input. This function is used for processing the output of the previous function fetchProjects which gives list of number of projects in a country. Then each of these projects are processed to count the frequencies of primary sectors and program types. It then sorts the primary sectors by the number of projects in descending order. Finally it returns the frequency of sorted primary sectors and count of projects by program type.
def getDataFromProjects(projects):
primary_sector_counter = Counter()
sector_programme_counter = Counter()
for project in projects:
# Count projects by primary sector
primary_sector = project["primary_sector_display"]
primary_sector_counter[primary_sector] += 1
programme_type = project["programme_type_display"]
sector_programme_counter[programme_type] += 1
# Sort primary sectors by count in descending order
sorted_primary_sectors = dict(
sorted(primary_sector_counter.items(), key=lambda x: x[1], reverse=True)
)
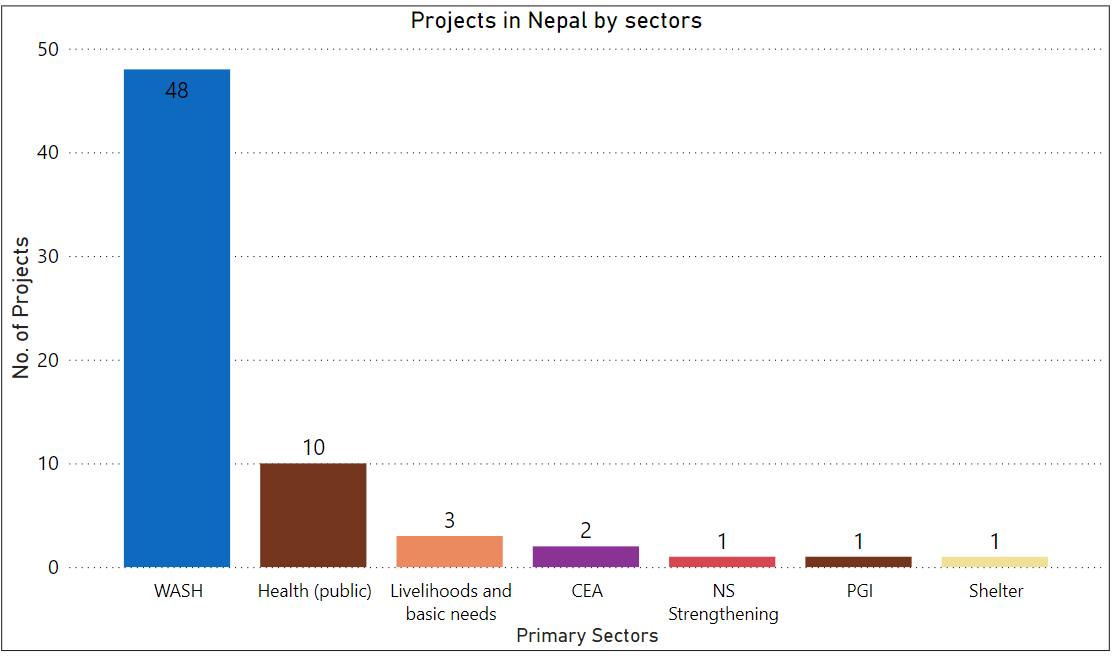
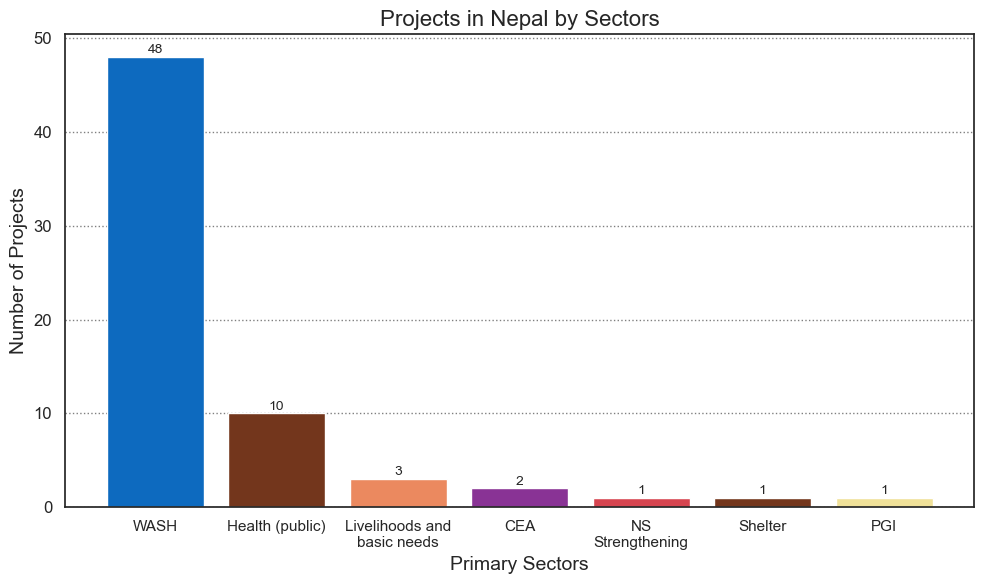
return sorted_primary_sectors, sector_programme_counterNext we define two more functions named textwrap and plotPrimarySectors for plotting barcharts to display the number of projects in Nepal by primary sector. The textwrap function is used the wrap the x axis labels on the plot which are the names of primary sectors in the data. We also display the count of projects by primary sectors in Nepal above each bar in the plot.
def wrap_labels(labels, width=15):
    wrapped_labels = [textwrap.fill(label, width) for label in labels]
    return wrapped_labels


def plotPrimarySectors(primary_sectors_data):
    labels, values = zip(*primary_sectors_data.items())
    wrapped_labels = wrap_labels(labels)
    custom_colors = [
        "#0d6abf",
        "#73361c",
        "#eb895f",
        "#893395",
        "#d64550",
        "#73361c",
        "#f0e199",
    ]

    plt.figure(figsize=(10, 6))
    plt.bar(range(len(wrapped_labels)), values, color=custom_colors, align="center")

    for index, value in enumerate(values):
        plt.text(
            index, value + 0.05, str(value), ha="center", va="bottom", fontsize=10
        )  # Display data labels on top of bars

    plt.xlabel("Primary Sectors", fontsize=14)
    plt.xticks(
        range(len(wrapped_labels)), wrapped_labels, rotation=0, ha="center", fontsize=11
    )  # Wrap and set x-tick labels
    plt.yticks(fontsize=12)
    plt.ylabel("Number of Projects", fontsize=14)
    plt.title("Projects in Nepal by Sectors", fontsize=16)
    plt.grid(True, axis="y", linestyle="dotted", alpha=0.5, color="black")

    plt.tight_layout()
plt.show()The code below is used to call the functions defined before. In summary, the code below fetches a list of projects in Nepal. Then the list of projects obtained are processed using the getDataFromProjects function and the output is used to plot the distribution of projects across different primary sectors in Nepal using the plotPrimarySectors function. The sequence of steps allows for the retrieval, analysis and visualization of projects data specific to Nepal from the IFRC API.
projects = fetchProjects("NPL")
sorted_primary_sectors = getDataFromProjects(projects)[0]
programme_type = getDataFromProjects(projects)[1]
plotPrimarySectors(sorted_primary_sectors)
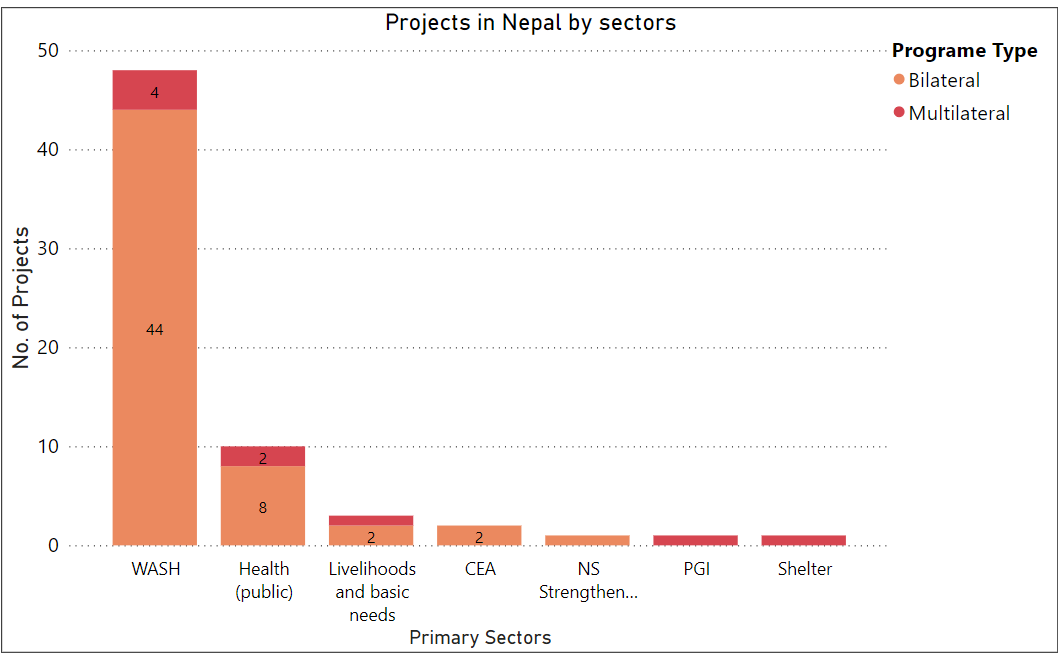
Next, we plot a grouped barchart to show the number of projects in Nepal by primary sector and program type. The function named projects_data_frames takes a list of projects as an input and creates a Dataframe with “Primary_sector_display” and "programme_type_display" as columns. It iterates through all the projects and extracts the specified columns, creates a dictionary for each project with the selected data and appends these dictionaries into a list. Finally this list of these dictionaries into pandas DataFrame and returns it as the output.
def projects_dataframe(all_results):
    selected_columns = ["primary_sector_display", "programme_type_display"]
    projects_data = []

    for project in all_results:
        selected_data = {key: project.get(key, None) for key in selected_columns}
        projects_data.append(selected_data)
    return pd.DataFrame(projects_data)
df = projects_dataframe(projects)For plotting we will be using another library called seaborn which makes it easier to plot grouped barcharts.
grouped_dfcontains counts of projects for each unique combination of 'primary_sector_display' and 'programme_type_display'.sorted_dfsums up the counts of projects for each primary sector and sorts them in descending order based on the total count.
We plot a grouped barchart using the sns.barplot method and then later on specify the X and Y axis labels along with the legend showing the program type.
grouped_df = (
    df.groupby(["primary_sector_display", "programme_type_display"])
    .size()
    .reset_index(name="count")
)
sorted_df = (
    grouped_df.groupby("primary_sector_display")["count"]
    .sum()
    .reset_index()
    .sort_values(by="count", ascending=False)
)
custom_palette = ["#d64550", "#eb895f"]


# Plot
plt.figure(figsize=(10, 6))
sns.set(style="white")

ax = sns.barplot(
    x="primary_sector_display",
    y="count",
    hue="programme_type_display",
    data=grouped_df,
    palette=custom_palette,
    dodge=False,
    order=sorted_df["primary_sector_display"],
)

for p in ax.patches[:-2]:
    width = p.get_width()
    height = p.get_height()
    x, y = p.get_xy()
    ax.annotate(f"{height:.0f}", (x + width / 2, y + height), ha="center")


# Wrap x tick labels

tick_labels = list(sorted_df["primary_sector_display"])
wrapped_labels = [textwrap.fill(label, width=15) for label in tick_labels]

plt.legend(loc="upper right", title="Program Type")

plt.xticks(tick_labels, wrapped_labels)

plt.xlabel("Primary Sectors", fontsize=14)
plt.ylabel("No. of projects", fontsize=14)
plt.title("Projects in Nepal by sectors", fontsize=16)
plt.grid(True, axis="y", linestyle="dotted", alpha=0.5, color="black")

plt.tight_layout()
plt.show()
¶ Sample API Query: Events in Countries
In this sample query we will be accessing the data from the Event API endpoint to calculate and visualize the number of events in India, Indonesia, Bangladesh and Nepal.
¶ API endpoint
In order to calculate and visualize the number of events in respective countries, we can build an API query in PowerBI or Microsoft Excel and later use bar chart (horizontal or vertical) to visualize the results. In this example we will be accessing the data from Event API endpoint. We will be filtering the data for our respective countries by using their ids. The ids for India, Indonesia, Bangladesh and Nepal are 84, 85, 27 and 123 respectively. So our URL for this specific query would look like this:
https://goadmin.ifrc.org/api/v2/event/?countries__in=123%2C84%2C85%2C27
- Here
https://goadmin.ifrc.org/api/is the base URL that tells PowerBI (or any other service/tool referencing the API) to connect with the GO server. - The
v2/event/refers to the latest version of the API. There are multiple data tables within the database and event tells GO to search for the table that stores events data ( as opposed to , say appeals, or the deployments. See https://goadmin.ifrc.org/api-docs/swagger-ui/ to see a full list of the available API endpoints. - The
countries__inparameter contains key-value pairs separated by ampersand ‘&’. 123%2C84%2C85%2C27 is the parameter value, where %2C represents a URL-encoded comma (,). URL encoding is used to represent characters in a URL that may have special meanings. In this case, %2C is the URL-encoded representation of a comma.
Since the data is coming from a paginated API, we will be utilizing the method used on the Pagination page along with the authorization token.
¶ Using PowerBI/ Excel
The steps needed to obtain data in PowerBI/ Excel are similar to the steps shown on the Projects per Sector page. However, there are some small modifications needed to obtain and transform the data for the respective countries.
- After opening the Power query editor, we have to define a parameters table which will contain the Authorization token along with the country ids of the four respective countries.
- The country ids of the four countries can be specified in the parameters table separated by a comma.
- Under the Home ribbon, from New Source, select Blank Query. Click on Advance editor, this will open the advance query editing dialog box. In the advance editor window, paste the following code:
let
    // Get the parameter values
    ParametersTable = Parameters,
    Token = Table.SelectRows(ParametersTable, each [Column1] = "Token"){0}[Column2],

    country_ids = Table.SelectRows(ParametersTable, each [Column1] = "country_ids"){0}[Column2],

    BaseUrl = "https://goadmin.ifrc.org",
    PageSize = 50,  // Number of items per page

    // Construct the query options based on parameter values
    queryOptions =

        [
            countries__in = if country_ids <> null then Text.From(country_ids) else "",
            limit = Text.From(PageSize),
            offset = "0"
        ],


    // Define a function to retrieve a page of data
    GetPage = (offset) =>
        let
            Url = BaseUrl,
            Headers = if Token <> null then [#"Accept-Language"="en", #"Authorization"="Token " & Token] else [#"Accept-Language"="en"],
            Response = Json.Document(Web.Contents(Url, [Headers=Headers, RelativePath = "api/v2/event/", Query=queryOptions & [offset = Text.From(offset)]])),
            Results = Response[results]
        in
            Results,

    // Define a function to combine all pages of data
    CombineAllPages = List.Generate(
        () => [Offset = 0],
        each let page = GetPage([Offset]) in page <> null and List.Count(page) > 0,
        each [Offset = [Offset] + PageSize],
        each GetPage([Offset])
    ),

    // Convert the combined pages to a table
    #"Converted to Table" = Table.FromList(CombineAllPages, Splitter.SplitByNothing(), null, null, ExtraValues.Error),
    #"Expanded Column1" = Table.ExpandListColumn(#"Converted to Table", "Column1")
in
    #"Expanded Column1"
You can also directly specify the country ids of the four countries and authentication token if you do not want to make the parameters table directly in the M code as follows:
Token = "your authetication token"

country_ids = "123,84,85,27"  // in case you want to retrieve the data for India, Indonesia, Bangladesh and Nepal
- In the code above the Token and country ids derive their values from the Parameters table that was constructed in the previous steps.
queryOptions: This variable constructs the query options for your API request.countryList: This lists all the country IDs provided in the parameters, excluding any null values.countries__in: This conditionally constructs thecountries__inparameter based on the number of countries provided. If there's more than one country, it combines them using commas. If there's only one country, it assigns that country directly. If there are no countries, it sets the parameter to null.GetPage: This function retrieves a page of data from the API endpoint. It constructs the URL using the base URL, appends the relative path to the event API (api/v2/event/), adds the query options including the offset, and makes a web request usingWeb.Contents. It returns the results of the API call.CombineAllPages: This function iteratively retrieves all pages of data from the API endpoint by callingGetPagewith different offsets. It starts with an initial offset of 0 and continues retrieving pages until the returned page is empty or null. It returns a list containing all the retrieved pages.
Just like in the previous example we have used the RelativePath and Query options for URL construction. Both of these are passed in the second argument of the Web.Contents() function so that there is no problem when a published dataset is refreshed. This version of query will successfully refresh in PowerBI or excel.
- Click on done. This creates a new query with a series of steps visible under the APPLIED STEPS on the right side of the query editor window. If the APPLIED STEPS are not visible click on Query Settings under the View ribbon.
- Now we can expand the data by clicking on the icon next to the column name. We can then choose the necessary features/ columns.
- We also need to expand the countries column in order to get the data related to countries ISO3 code, name, region, society name etc.
- Next we filter out the data for the ISO3 codes of the respective countries. After completing these steps we can click on close and apply on the top left of the power query editor window.
¶ Visualization in PowerBI
The steps to visualize the events in countries are similar to what has been shown in Projects per Sector page. We can build the chart by selecting the bar chart from the visualization section. After this selection, a blank place holder will appear in the preview pane. From the data tab select the table which has the data of the events in countries and find the countries.iso3 field. To show the data on the chart you need to drag this field in the X-axis and Y-axis. Power BI will automatically display the frequency/ count of the events and construct the bars for the respective countries. The data labels to show the number of events can be shown by enabling the Data labels from the format option under the visualizations option.
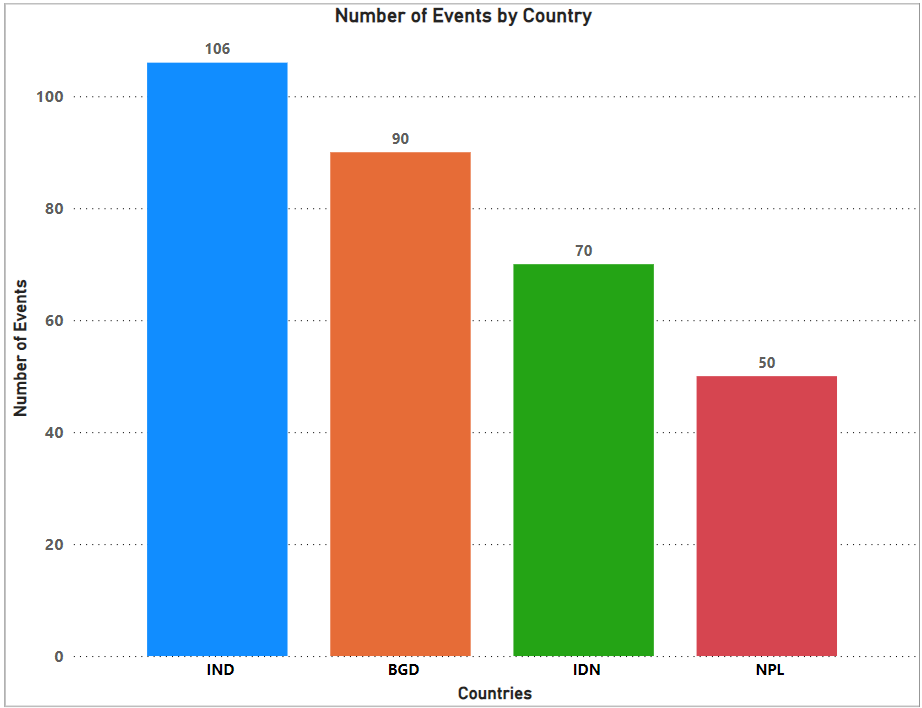
The Bar chart can be customized, for example by changing the names, sizes and colors of the axis, titles and bar colors. The following chart can be obtained after applying the above steps with user's own customizations.
¶ Using Python
In this section we will show how the data can be received from the Event API endpoint and filter the data using the countries__in parameter. To authenticate, we will also add the authentication token when building the API request.
We start the process by first importing necessary libraries that will be used in data processing and visualization.
import requests
from collections import defaultdict
import matplotlib.pyplot as plt requests: Allows you to send HTTP requests to the API endpoint.defaultdict: A dictionary with default values for handling the event counts.matplotlib.pyplot: Provides a MATLAB-like interface for creating static, interactive, and animated visualizations in Python.
def get_data_from_response_results(response_results, response_result_key):
    data = {"labels": [], "datasets": [{"data": []}]}
    for response_result in response_results:
        countries_data = response_result.get(response_result_key, [])
        if countries_data:
            iso3_codes = [country["iso3"] for country in countries_data]
            data["labels"].extend(iso3_codes)
            data["datasets"][0]["data"].append(len(iso3_codes))
return dataWe define a helper function named get_data_from_response_results. this function processes the API response, extracts ISO3 codes of countries, and counts the number of countries in each response result. The resulting data structure is suitable for creating charts or visualizations
response_results: This parameter represents a list of dictionaries. Each dictionary in this list contains information about countries retrieved from the API response.response_result_key: This parameter specifies the key in each dictionary where the list of countries' ISO3 code data can be found.
def call_go_api():
    go_api_url = "https://goadmin.ifrc.org/api/v2/event/"
    event_counts = defaultdict(int)
    offset = 0
    auth_token = "your authorization token"
    headers = {"Authorization": f"Token {auth_token}"}

    while True:
        params = {
            "countries__in": "123,84,85,27",
            "format": "json",
            "limit": 50,  # Each page contains 50 entries
            "offset": offset,
        }
        response = requests.get(go_api_url, params=params, headers = headers)
        go_api_response = response.json()

        parsed_go_api_response = get_data_from_response_results(
            go_api_response["results"], "countries"
        )

        for country_iso3 in parsed_go_api_response["labels"]:
            event_counts[country_iso3] += 1

        if go_api_response["next"] is not None:
            offset += 50
        else:
            break

    return event_counts
The call_go_api function is used to call the API endpoint and receive data from each and every page as the API is paginated. The function enters into a while loop and continues to fetch data until there is no valid URL response. params is a dictionary that contains the query parameters like the country ids , format of the response, offset and limit. The API authorization is done by specifying a headers dictionary which contains the authorization token of the user. These params helps us to filter the data for the countries we need. event_counts is a default dictionary initialized with integer values. This will be used to store the count of events for each country.
The extracted country codes are used to update the event_counts dictionary, incrementing the count for each country code encountered.
def chart():
    # Fetch event counts from the Go API
    event_counts = call_go_api()

    # Sort the event counts dictionary by values in descending order
    sorted_event_counts = dict(
        sorted(event_counts.items(), key=lambda item: item[1], reverse=True)
    )

    # Select the top 4 countries and their event counts
    top_countries = list(sorted_event_counts.keys())[:4]
    top_event_counts = list(sorted_event_counts.values())[:4]

    # Define custom colors (hexadecimal codes)
    custom_colors = ["#1f77b4", "#ff7f0e", "#2ca02c", "#d62728"]

    # Create a bar chart with custom colors and larger axis labels and tick labels
    plt.figure(figsize=(9, 7))

    bars = plt.bar(top_countries, top_event_counts, color=custom_colors, zorder=2)

    # Display data labels (counts) on the bars
    for bar, label in zip(bars, top_event_counts):
        plt.text(
            bar.get_x() + bar.get_width() / 2 - 0.15,
            bar.get_height() + 0.1,
            str(label),
            ha="center",
            fontsize=10,
        )

    plt.xlabel("Countries", fontsize=12)  # Set the font size for the X-axis label
    plt.ylabel(
        "Number of Events", fontsize=12
    )  # Set the font size for the Y-axis label
    plt.title(
        "Number of Events by Country", fontsize=12
    )  # Set the font size for the chart title

    # Set the font size for X-axis tick labels
    plt.xticks(rotation=0, fontsize=12)  # Rotation set to 0 for horizontal labels

    # Set the font size for Y-axis tick labels
    plt.yticks(fontsize=12)
    plt.grid(True, axis="y", linestyle="dotted", alpha=0.5, color="black", zorder=1)
    plt.tight_layout()
    plt.savefig("C:/Users/arun.gandhi/Downloads/ac.png")


# Call the chart function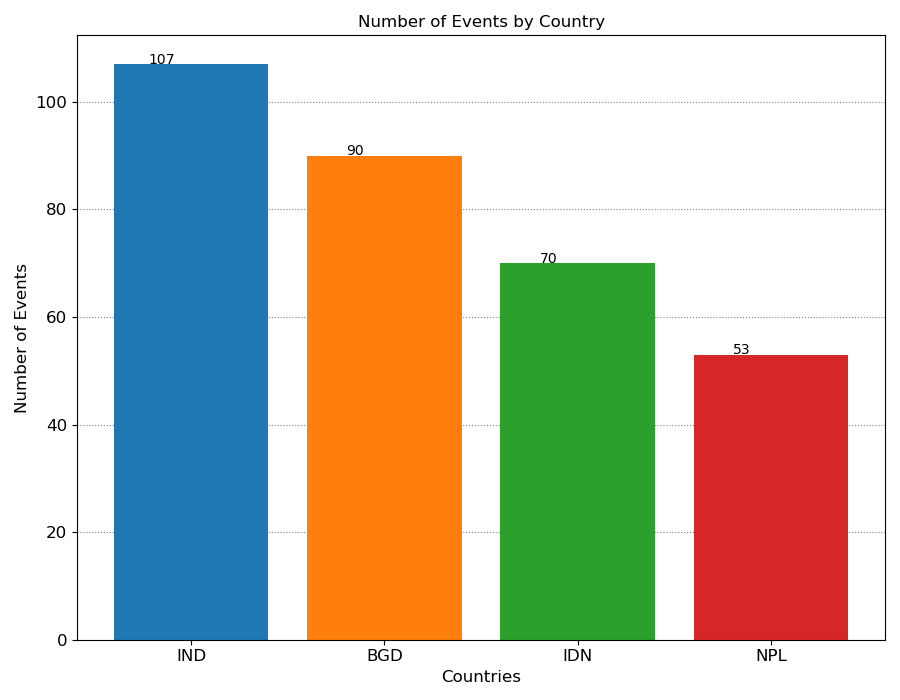
chart()We define another function named chart to plot the respective number of events in countries queried. We extract the country ISO3 code and the corresponding event counts and plot them on a bar chart using the matplotlib library. The figure below shows the number of events in India, Indonesia, Nepal and Bangladesh.
¶ Sample API Query: Appeal Documents by Appeal Code
In this section we will show how a appeal document can be accessed using an appeal code.
¶ API endpoints
In order to access the appeal documents we will be using two API endpoints namely appeal and appeal_documents. We use an appeal code (alphanumeric code) as an input parameter to extract the data of appeals submitted by the Red Cross society in a country related to a country cluster.
From the appeals data we have to extract the appeal ID stored in the variable named aid. It contains a unique identifier of the appeal provided by the Apple system. The extracted unique identifier of the appeal is later used as an input parameter in the appeal_documents endpoint to fetch the related appeal documents in a table.
The table will contain URLs of appeal documents which can be used to download the reports associated with an appeal made for a disaster in a pdf format.
In this example , the data associated with the API endpoints has been accessed using PowerBI/ Microsoft Excel and python. So our URLs for this specific example would look like this:
https://goadmin.ifrc.org/api/v2/appeal/?code=MDRCM002
- Here
https://goadmin.ifrc.org/api/tells PowerBI (or any other service/tool referencing the API) to connect with the GO server. All of your API calls to GO will start with this as a base URL. - The
v2/appeal/refers to the latest version of the API. There are multiple data tables within the database and project tells GO to search for the table that stores appeals data ( as opposed to say deployments. Seehttps://goadmin.ifrc.org/api-docs/swagger-ui/to see a full list of the available API endpoints. - The
code=MDRCM002is a query parameter which provides additional information to search for the data specific to the appeal with the code “MDRCM002”.
In order to access the appeal documents the following URL is used:
https://goadmin.ifrc.org/api/v2/appeal_document/?appeal={appeal_id}
- Same as before the
https://goadmin.ifrc.org/api/tells a service/ tool referencing the API to connect withe GO server andv2/appeal/refers to the latest version of the API. - The
appeal={appeal_id}is a query parameter which provides an appeal id to search for appeal documents associated with that particular appeal id. The appeal id is extracted from the appeals dataset and used as an input parameter for searching appeal documents.
¶ Using PowerBI/ Excel
In this example we have two API endpoints namely the appeal and appeal_document. The former will be used to extract the appeal ID by providing appeal code as a search parameter. Each appeal ID is unique and is associated with a single appeal code. The extracted appeal ID is then used as a search parameter in the appeal_document API endpoint to fetch the appeal documents associated with the provided appeal ID.
We will fetch the appeal ID by using Postman application as shown below:
- Under the name of your collection click on Add a Request. To create a new collection follow the steps shown on the page Generating an API Token.
- In the main window that appears click
GET. TheGETmethod is used request data from a web server. - In the field labeled as Enter URL or paste text, type
https://goadmin.ifrc.org/api/v2/appeal/?code=MDRCM002.
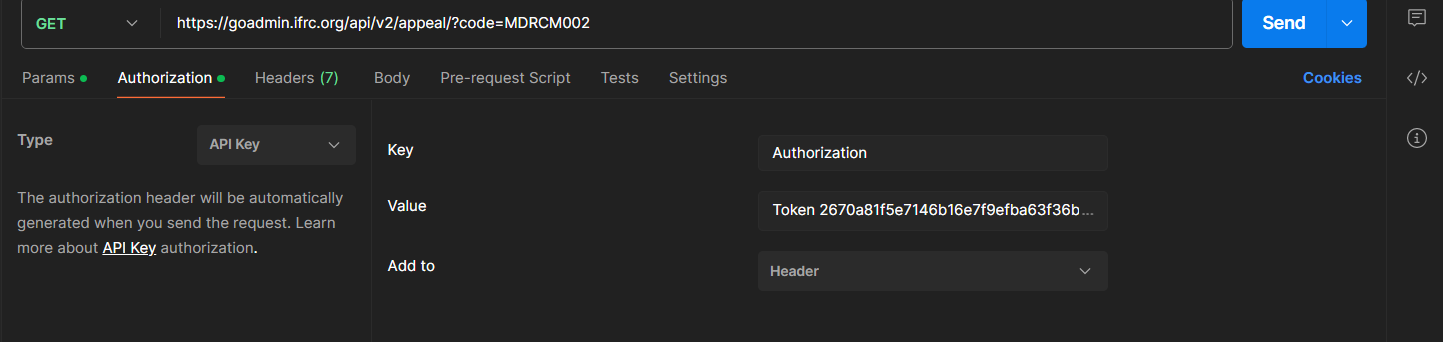
- To ensure that we are using the Authorization token, click on the Authorization option under the URL box and select Bearer Token from the drop down list.
- After selecting Bearer Token option, user can enter the authorization token in the box on the right side. To generate the API authorization token, follow the steps shown on the page
Generating an API Token. - After following the above steps, click on Send option in the top right corner. If you have entered everything correctly, then you should get the following JSON response from the server under the Body.
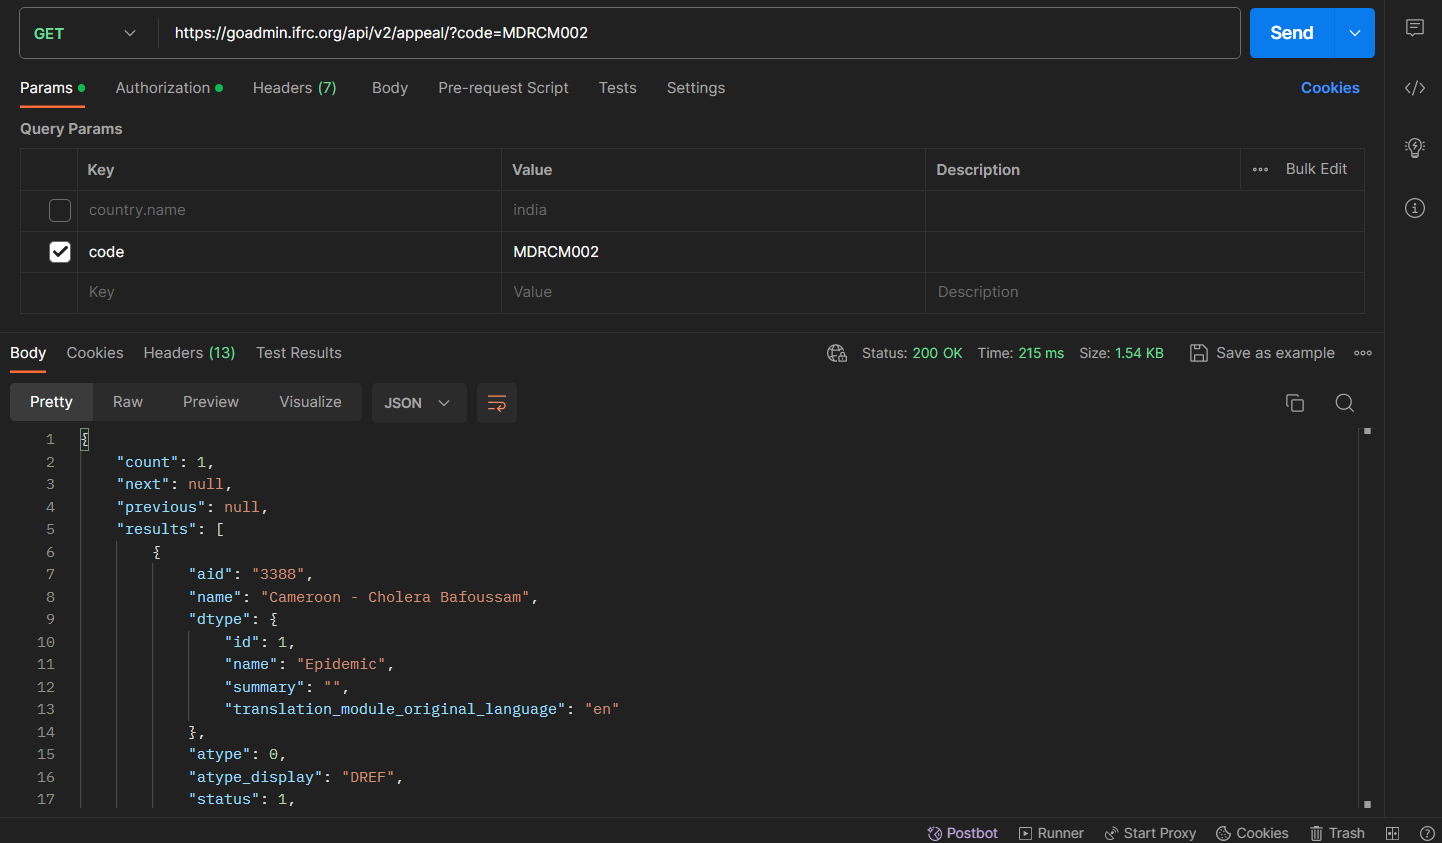
- From the response obtained, copy/save the value in front of the key named aid.
To fetch the appeal documents we can build a Query inside the Power Query editor of PowerBI or Excel by following the steps below:
- Open the Power query editor by selecting the Transform data from the top ribbon.
- Define a Parameters table which will contain the Authorization token along with a parameter named appeal_id which will be used to filter out the data.
- Under the Home ribbon, from New Source, select Blank Query. Click on Advance editor, this will open the advance query editor dialog box. In the advance editor window, paste the following code:
let
    // Get the parameter values
    ParametersTable = Parameters,
    Token = Table.SelectRows(ParametersTable, each [Column1] = "Token"){0}[Column2],

    appeal_id = Table.SelectRows(ParametersTable, each [Column1] = "appeal_id"){0}[Column2],


    BaseUrl = "https://goadmin.ifrc.org",
    PageSize = 50,  // Number of items per page

    // Construct the query options based on parameter values
    queryOptions =
        [
            appeal = if appeal_id <> null then Text.From(appeal_id) else "",
            limit = Text.From(PageSize),
            offset = "0"
        ],

    // Define a function to retrieve a page of data
    GetPage = (offset) =>
        let
            Url = BaseUrl,
            Headers = if Token <> null then [#"Accept-Language"="en", #"Authorization"="Token " & Token] else [#"Accept-Language"="en"],
            Response = Json.Document(Web.Contents(Url, [Headers=Headers, RelativePath = "api/v2/appeal_document/", Query=queryOptions & [offset = Text.From(offset)]])),
            Results = Response[results]
        in
            Results,

    // Define a function to combine all pages of data
    CombineAllPages = List.Generate(
        () => [Offset = 0],
        each let page = GetPage([Offset]) in page <> null and List.Count(page) > 0,
        each [Offset = [Offset] + PageSize],
        each GetPage([Offset])
    ),

    // Convert the combined pages to a table
    #"Converted to Table" = Table.FromList(CombineAllPages, Splitter.SplitByNothing(), null, null, ExtraValues.Error),
    #"Expanded Column1" = Table.ExpandListColumn(#"Converted to Table", "Column1")

in
    #"Expanded Column1"
- We define a
queryOptionsfunction which is used to filter the appeal documents based on the given appeal id.if appeal_id <> null then Text.From(appeal_id) else null: This ternary conditional statement checks if theappeal_idvariable is not null. If it's not null, it converts theappeal_idto text usingText.From(). Otherwise, it sets theappealparameter to null. - After the code has been pasted in the advance editor window, click on done. A series of steps will be added in the APPLIED STEPS on the right side of the query editor window.
- After that we can expand the data by selecting the necessary columns/ fields. This can be done by clicking on the icon next to the name of the column.
- At the moment we select all the columns. This will load the data of the documents associated with the appeal ID 3378.
- Click on Close & Apply at the top of the Power Query editor window.
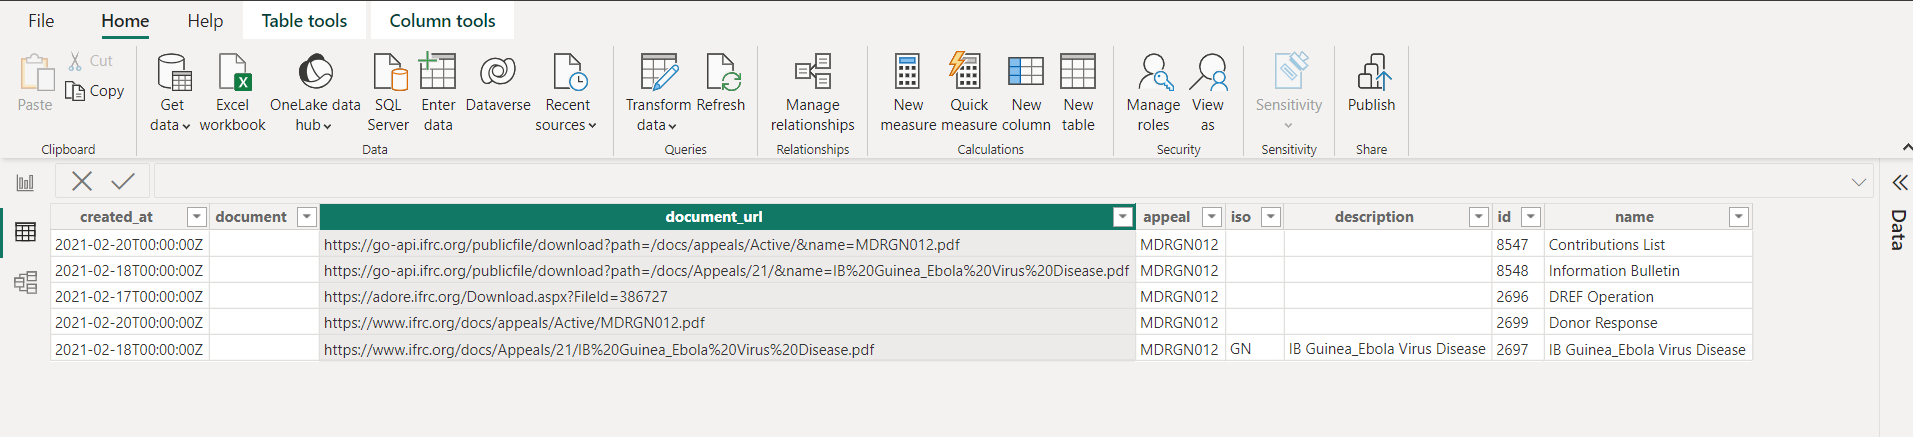
- Select the Data View option on the left side to see the data loaded. At the moment we can see only 5 appeal documents. The document's pdfs can be downloaded by using the URLs under the document_url column.
¶ Using Python
In this section we will show how the data can be accessed using python from the respective API endpoints. We will also use the API authentication token while constructing this API request.
We start the process by importing the necessary libraries used for data processing.
requests: it is a popular python library used for making HTTP requests.json: It is a python library that provides methods for dealing with JSON data. The JSON module can parse JSON from strings or files. It can convert python dictionaries or lists into JSON strings.pandas: It is a powerful library for data analysis in python.
import requests
import json
import pandas as pd
auth_token = "your_authorization_token"Next we define a function called fetch_appeal_data which fetches appeal data from the appeal API endpoint based on the provided appeal code. It then extracts the appeal ID from the API response and returns it.
def fetch_appeal_data(appeal_code):
    appeal_url = f"https://goadmin.ifrc.org/api/v2/appeal/?code={appeal_code}"
    headers = {"Authorization": f"Token {auth_token}"}
    appeal_response = requests.get(appeal_url, headers=headers)
    appeal_data = json.loads(appeal_response.text)
    appeal_id = appeal_data["results"][0]["aid"]
return appeal_idNext we define a function called fetch_documents_data to fetch the appeals documents data. It uses three input parameters namely appeal_id, offset and page_size to return a list of documents. The offset parameter has been used to control for the pagination of the API endpoint.
def fetch_documents_data(appeal_id, offset=0, page_size=50):
    documents_url = f"https://goadmin.ifrc.org/api/v2/appeal_document/?limit={page_size}&offset={offset}&appeal={appeal_id}"
    headers = {"Authorization": f"Token {auth_token}"}
    documents_response = requests.get(documents_url, headers=headers)
    documents_data = json.loads(documents_response.text)
return documents_data["results"]The function all_documents is used to fetch all the documents associated with the appeal code by paginating through the API responses. It collects all the data and then converts in into a pandas DataFrame and then returns it. The function loops through all the API endpoint pages and stops when there are no more documents returned. It uses the output of the previously defined functions as they are called with in the function definition.
def all_documents(appeal_code):
    appeal_id = fetch_appeal_data(appeal_code)

    # Initialize an empty list to store appeal documents
    appeal_documents = []
    offset = 0
    page_size = 50

    # Fetch all documents data from the paginated API endpoint
    while True:
        documents_data = fetch_documents_data(appeal_id, offset=offset, page_size=page_size)
        current_page_documents = documents_data

        # Break the loop if there are no more documents
        if not current_page_documents:
            break

        # Extend the list of appeal documents with documents from the current page
        appeal_documents.extend(current_page_documents)

        # Increment offset for the next page
        offset += page_size

    # Create a DataFrame from the list of dictionaries
    df = pd.DataFrame(appeal_documents)

    return df
Now, we call the function all_documents with the specified appeal code and then prints it.
# Call the function with the specified appealCode and get the DataFrame
appeal_documents_df = all_documents('MDRCM002')

# Print the DataFrame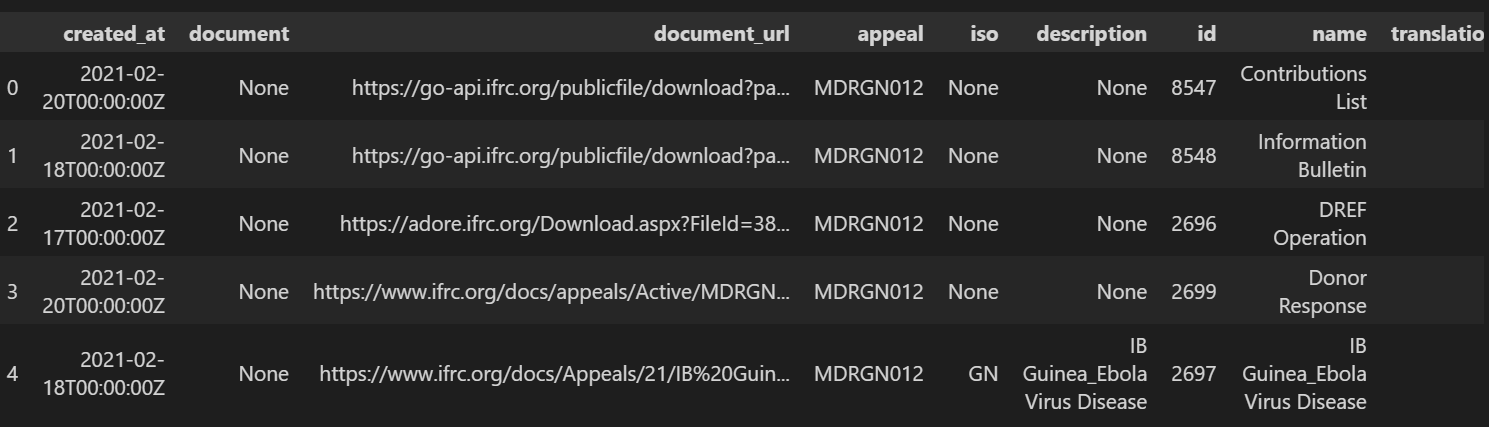
print(appeal_documents_df)As a result of running the above code, the data would appear in a table as shown below. The column named documents_url contains the URLs of the appeal documents allowing the user to download the pdf of the specific document.
¶ Sample API Query: Projects per Status
In this example we will access the data from the Projects API endpoint and visualize the number of projects as per the status using PowerBI and Python. Projects in a country have been classified into three categories namely:
- Planned
- Ongoing
- Completed
¶ API Endpoint
To access the data of Projects, we will be using the Projects API endpoint. We will be accessing the projects in Sudan and this can be achieved by setting the parameter Country to Sudan. In the API URL, we need to specify the 3 letter ISO3 code for Sudan which is “SDN”.
So the URL for accessing the data would look like this:
https://goadmin.ifrc.org/api/v2/project/?country_iso3=SDN
¶ Using Power BI/ excel
The procedure for getting the data in Power BI is similar to what has been done in the Projects per Sector page.
- Select the Transform data from the top ribbon to open the Power Query editor.
- Define a parameters table which will contain the Authorization token and country ISO3 code as parameters. We can construct a table by clicking on the Enter Data option under the Home ribbon and write the Authorization code and 3 letter ISO3 code. In this example we will querying the data for Sudan which has
SDNas the ISO3 code. - Click Ok and a new query will be generated under the Queries window. We rename this query as Parameters.
- Now we will construct another query which will be used in fetching the data from the Projects API endpoint. Under the home ribbon, from New Source, select Blank Query. Click on Advance editor, this will open the the Advance query editor dialog box. In the Advance editor window we have to paste the code below. The only difference we observe is the change of ISO3 code to
SDNfor Sudan
let
    // Get the parameter values
    ParametersTable = Parameters,
    Token = Table.SelectRows(ParametersTable, each [Column1] = "Token"){0}[Column2],

    country_iso3 = Table.SelectRows(ParametersTable, each [Column1] = "country_iso3"){0}[Column2],


    BaseUrl = "https://goadmin.ifrc.org",
    PageSize = 50,  // Number of items per page

    // Construct the query options based on parameter values
    queryOptions =
        [
            country_iso3 = if country_iso3 <> null then Text.From(country_iso3) else "",
            limit = Text.From(PageSize),
            offset = "0"
        ],

    // Define a function to retrieve a page of data
    GetPage = (offset) =>
        let
            Url = BaseUrl,
            Headers = if Token <> null then [#"Accept-Language"="en", #"Authorization"="Token " & Token] else [#"Accept-Language"="en"],
            Response = Json.Document(Web.Contents(Url, [Headers=Headers, RelativePath = "api/v2/project/", Query=queryOptions & [offset = Text.From(offset)]])),
            Results = Response[results]
        in
            Results,

    // Define a function to combine all pages of data
    CombineAllPages = List.Generate(
        () => [Offset = 0],
        each let page = GetPage([Offset]) in page <> null and List.Count(page) > 0,
        each [Offset = [Offset] + PageSize],
        each GetPage([Offset])
    ),

    // Convert the combined pages to a table
    #"Converted to Table" = Table.FromList(CombineAllPages, Splitter.SplitByNothing(), null, null, ExtraValues.Error),
    #"Expanded Column1" = Table.ExpandListColumn(#"Converted to Table", "Column1")
in
    #"Expanded Column1"
- After the code has been pasted in the advance editor window, click on done. A series of steps will be added in the APPLIED STEPS on the right side of the query editor window.
- After that we need to expand the data and selecting the necessary features/ columns. we can do this by clicking on the icon next to the name of the column.
- At the moment we will select only a few columns namely: primary_sector_display, secondary_sectors_display, operation_type_display, programme_type_display and status_display.
- Now we’re able to see what data this query is actually providing us! We’re ready to start building our visuals, so click Close and Apply at the top of your Power Query Editor window
¶ Visualization in PowerBI
The steps to visualize the events in countries are similar to what has been shown in Projects per Sector page. We can build the chart by selecting the bar chart from the visualization section. After this selection, a blank place holder will appear in the preview pane. From the data tab select the table which has the data of the projects in countries and find the status_display field. To show the data on the chart you need to drag this field in the X-axis and Y-axis. Power BI will automatically display the frequency/ count of the projects by their status and construct the bars bars showing the project statuses. The data labels to show the number of projects can be shown by enabling the Data labels from the format option under the visualizations option.
The Bar chart can be customized, for example by changing the names, sizes and colors of the axis, titles and bar colors. The following chart can be obtained after applying the above steps with user's own customizations.
¶ Using Python
In this section, we will show how data for projects in Sudan can be retrieved from the API endpoint and visualized using python. Following Python code can be used in Jupyter notebooks. Jupyter notebooks area a popular cloud base interface that allows the users to create and share documents with code, equations, visualization and text.
To start the process, we first have to import the following python libraries:
Requests: For sending HTTP request to the API endpointMatplotlib.pyplot: Provides a MATLAB-like interface for creating static, interactive and animated visuals in Python.Numpy: Provides support for creating and handling large, multidimensional arrays and matrices.
import requests
import matplotlib.pyplot as plt
import numpy as np
auth_token = 'Your authorization token'Next we define a function named fetch_project_data. This function is receives data from the API endpoint specified by the API URL and parameters. It iteratively fetches data from all pages in the API response and stores them in a list named all_projects. After fetching, it processes the data to create status_counts dictionary, counting the occurrence of each project status. The function returns a dictionary, summarizing the counts of project statuses obtained from the API.
def fetch_project_data(api_url, params, headers):
all_projects = []
# Fetch data from all pages of the API endpoint
while True:
response = requests.get(api_url, params=params, headers = headers)
page_data = response.json().get("results", [])
all_projects.extend(page_data)
# Check if there are more pages
next_page = response.json().get("next")
if next_page:
params["offset"] += params["limit"] # Move to the next page
else:
break # No more pages, exit the loop
# Process data and generate status counts
status_counts = {}
for project in all_projects:
status = project.get("status_display")
if status in status_counts:
status_counts[status] += 1
else:
status_counts[status] = 1
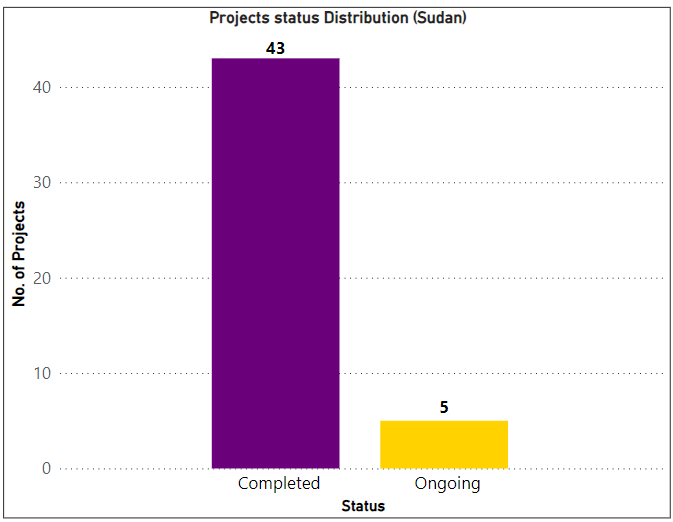
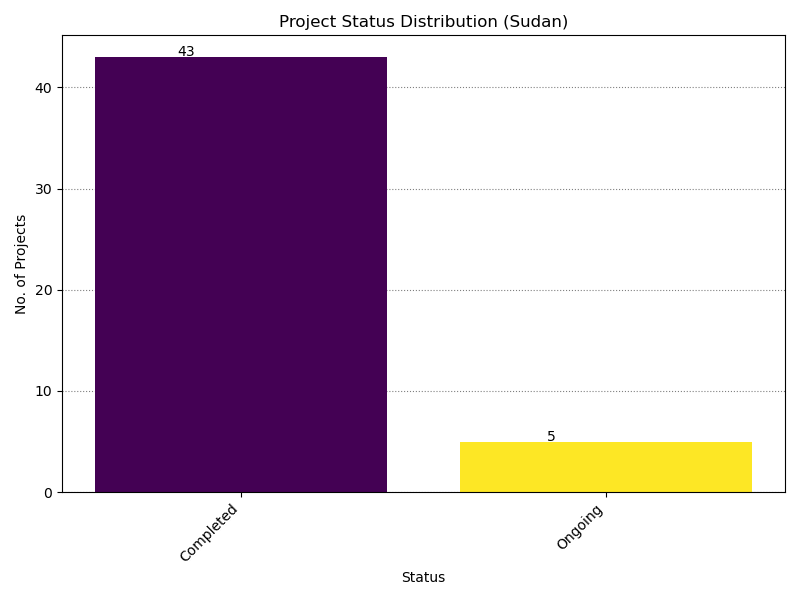
return status_countsThe plot_status_distribution function takes a dictionary status_counts containing the counts of projects statuses. It is used to generate a bar chart to visualize the distribution of project statuses. The resulting plot provides a visual representation of the distribution of projects as per their status in Sudan.
def plot_status_distribution(status_counts):

    status_labels = list(status_counts.keys())
    status_data = list(status_counts.values())

    # Generate a list of colors based on the number of status_labels
    num_colors = len(status_labels)
    colors = plt.cm.viridis(np.linspace(0, 1, num_colors))

    # Create a bar chart
    plt.figure(figsize=(8, 6))
    bars = plt.bar(status_labels, status_data, color= colors)

    # Annonate bars with data labels
    for bar, labels in zip (bars, status_labels):
    	plt.text(bars.get_x() + bars.get_width()/2 - 0.15, bars.get_height()+0.1, str(label),
    	ha = 'center', fontsize = 10, zorder = 3)
    plt.xlabel('Status')
    plt.ylabel('# of Projects')
    plt.title('Project Status Distribution')
    plt.xticks(rotation=45, ha="right")
    plt.tight_layout()
    plt.show()
Lastly, we specify the, API URL, params and headers. We call the helper functions defined before to first fetch the projects data in Sudan and then use the plot_status_distribution function to visualize the number of projects in Sudan as per their status.
# Define the API endpoint URL and initial parameters
api_url = "https://goadmin.ifrc.org/api/v2/project/"
params = {
    "country_iso3": "SDN",
    "limit": 50,
    "offset": 0,
}  # Initial parameters for the first page

headers = {"Authorization": f"Token {auth_token}"}


# Fetch project data and plot the status distribution
status_counts = fetch_project_data(api_url, params, headers)
plot_status_distribution(status_counts)
¶ Surge Alerts grouped by Deployments needed
In this example we will calculate the number of Surge Alerts for which Deployments are needed in PowerBi and python. For this purpose we will use the Surge Alerts API endpoint to retrieve the data.
¶ API Endpoint
To access the data of surge alerts, the URL of the API endpoint would look like this:
https://goadmin.ifrc.org/api/v2/surge_alert/?search=Population+Movement
We are providing “Population Movement” string as a search parameter to search for the data in surge alert tables corresponding to the events related to population movements.
¶ Using PowerBI/ Excel
The steps needed to obtain data in PowerBI/ Excel are similar to the steps shown on the Projects per Sector page. However, there are some small modifications needed to obtain and transform the data related to Population Movements in surge alerts.
- After opening the Power query editor, we have to define a parameters table which will contain the Authorization token along with a parameter named search. This search parameter is used to filter out the events related to a specific string.
- Under the Home ribbon, from New Source, select Blank Query. Click on Advance editor, this will open the advance query editing dialog box. In the advance editor window, paste the following code:
let
    // Get the parameter values
    ParametersTable = Parameters,
    Token = Table.SelectRows(ParametersTable, each [Column1] = "Token"){0}[Column2],

    search = Table.SelectRows(ParametersTable, each [Column1] = "search"){0}[Column2],


    BaseUrl = "https://goadmin.ifrc.org",
    PageSize = 50,  // Number of items per page
    // Construct the query options based on parameter values
    queryOptions =
        [
            search = if search <> null then Text.From(search) else "",
            limit = Text.From(PageSize),
            offset = "0"
        ],

    // Define a function to retrieve a page of data
    GetPage = (offset) =>
        let
            Url = BaseUrl,
            Headers = if Token <> null then [#"Accept-Language"="en", #"Authorization"="Token " & Token] else [#"Accept-Language"="en"],
            Response = Json.Document(Web.Contents(Url, [Headers=Headers, RelativePath = "api/v2/surge_alert/", Query=queryOptions & [offset = Text.From(offset)]])),
            Results = Response[results]
        in
            Results,

    // Define a function to combine all pages of data
    CombineAllPages = List.Generate(
        () => [Offset = 0],
        each let page = GetPage([Offset]) in page <> null and List.Count(page) > 0,
        each [Offset = [Offset] + PageSize],
        each GetPage([Offset])
    ),

    // Convert the combined pages to a table
    #"Converted to Table" = Table.FromList(CombineAllPages, Splitter.SplitByNothing(), null, null, ExtraValues.Error),
    #"Expanded Column1" = Table.ExpandListColumn(#"Converted to Table", "Column1")
in
    #"Expanded Column1"
- After the code has been pasted in the advance editor window, click on done. A series of steps will be added in the APPLIED STEPS on the right side of the query editor window.
- After that we need to expand the data and selecting the necessary features/ columns. we can do this by clicking on the icon next to the name of the column.
- At the moment we will select only a few columns namely: country, deployment_needed, atype, atype_display, category and category_display. It is also important to change the format of data in the deployment_needed column to true/false.
- Now we’re able to see what data this query is actually providing us! We’re ready to start building our visuals, so click Close and Apply at the top of your Power Query Editor window.
¶ Visualization in PowerBI
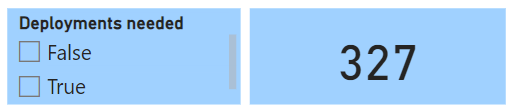
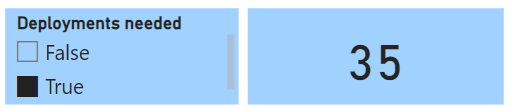
To calculate and show the status of deployments, we can either calculate two measures or use slicer and card visualization. In this example we will use the slicer and card visualization options available under the visualization section. In Power BI, a slicer is a visualization feature that allows users to filter data in reports or dashboards interactively. Slicers are especially useful when you want to provide a user-friendly way for viewers to filter data without having to go into the report editor or modify the underlying data model.
- First we select the slicer and upon selection a blank placeholder will appear in the preview pane.
- From the data tab select the table which has the data of surge alerts and find the deployment_needed field. We can drag this field under ‘Field’ option shown in the visualizations pane. Power Bi will automatically show the categories (True/ False in this case) in the slicer.
- Next we select the Card option to visualize the count of deployments needed. We drag the field named deployment_needed and drop it under the ‘Feild’ option in the visualizations pane.
The slicer will enable to filter the counts of deployments needed. The visualizations can be customized by changing the title names, sizes and colors of labels as well as slicer style. The following slicer and card visualization is obtained after applying the above steps with user's own customizations. In this example, we observe a total of 327 surge alerts for which only 35 deployments are needed.
¶ Using Python
To retrieve and analyze data in Python, the following code can be implemented in Jupyter notebooks. First we will import the requests library which is used to send HTTP request to the API endpoint.
import requestsNext, we define a function called fetch_surge_alerts to fetch the data of surge alerts from all API pages and then extracts the alert id and status of deployments for every surge alert in a dictionary. It takes an input parameter search which allows for a general search on the surge alerts table stored on the GO server. The function then returns a list containing this dictionary as the output.
def fetch_surge_alerts(search):
    all_surge_alerts = []
    offset = 0
    limit = 50  # Number of records per page
    auth_token = "your authorization token"

    headers = {"Authorization": f"Token {auth_token}"}

    params = {
        'offset': offset,
        'limit': limit,
        'search': search
    }

    while True:
        response = requests.get('https://goadmin.ifrc.org/api/v2/surge_alert/',
                                headers=headers, params=params)
        data = response.json()
        surge_alerts = [{'id': alert['id'], 'deployment_needed': alert['deployment_needed']}
                        for alert in data.get('results', [])]

        # If there are no more surge alerts, exit the loop
        if not surge_alerts:
            break

        # Add surge alerts from the current page to the list of all surge alerts
        all_surge_alerts.extend(surge_alerts)

        # Move to the next page
        offset += limit
        params['offset'] = offset

    return all_surge_alerts
Another function is defined called deployments_needed, which takes a list of surge alerts as input. It iterates through surge alerts, checks if the deployment_needed field is present in the labels list. If found then it increments the corresponding count in the data_values list; otherwise, it adds the condition to labels with a count of 1. Finally, it returns a dictionary containing labels (True or False) and data count for each condition.
def deployments_needed(surge_alerts):
labels = []
data_values = []
for alert in surge_alerts:
if alert['deployment_needed'] in labels:
index = labels.index(alert['deployment_needed'])
data_values[index] += 1
else:
labels.append(alert['deployment_needed'])
data_values.append(1)
chart_data = {
'labels': labels,
'data': data_values
}
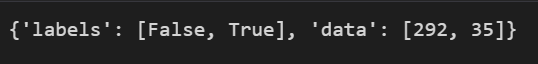
return chart_data
In the code below, we call both the functions that have been defined before. We provide a string ‘Population Movement’ as an input parameter to fetch the related surge alerts. The resulting list of surge alerts is fed to the next function to obtain the data of status of deployments. Finally we can print the results to see for how many surge alerts, deployments have been made and vice versa. In this case we can see that for all the surge alerts issued only 35 deployments have been made, however this number can change in the future and the data will updated on the server.
no_surge_alerts = fetch_surge_alerts(search = 'Population Movement')
deployments = deployments_needed(surge_alerts)

print(deployments)
¶ Using two different filters on Event API endpoint
In this example we will show how we can use two or more different parameters to filter out the data from the Event API endpoint using PowerBI/ Excel and python. The Event API endpoint shows the data of the list of emergencies as well as the associated appeals filed by the various red cross national societies. It is not necessary that an emergency is always associated with an appeal.
¶ API Endpoint
In this example we will be using two different filters namely regions_in and disaster_start_date__gte. The first parameter can be used to filter out the data for any particular IFRC region and the second filter is used to filter out the emergencies or disasters based on the specified date and time. The second parameter will provide us with a list of all disasters that occurred on and after the specified date. In this example we will be retrieving the data of emergencies for Africa region occurring after 1st January 2012. To access the data for emergencies, the URL of the API endpoint is given below:
https://goadmin.ifrc.org/api/v2/event/?disaster_start_date__gte=2012-01-01T00%3A00%3A00®ions__in=0
As can be seen above we will use two parameters to filter out the list of emergencies. It is to be noted that in this request URL, the %3A is a URL-encoded representation of the colon (:) character.
¶ Using PowerBI/Excel
The steps needed to obtain data in PowerBI/Excel are similar to the steps shown in other Sample API Queries. However, there are some modifications required to obtain and transform the data when using two or more parameters to filter the data. These modification are mentioned below:
- After opening the Power query editor, we have to define a parameters table which will contain the Authorization token along with with two other parameters which will be used for filtering out the data. The two other parameters are named as
regionanddisaster_start_date_gtedate in the parameters table. - Under the Home ribbon, from New Source, select Blank Query. Click on Advance editor, this will open the advance editing dialog box. In this advance editor window, paste the following code:
let
    // Get the parameter values
    ParametersTable = Parameters,
    Token = Table.SelectRows(ParametersTable, each [Column1] = "Token"){0}[Column2],

    region = Table.SelectRows(ParametersTable, each [Column1] = "region"){0}[Column2],
    disaster_start_date_gte = Table.SelectRows(ParametersTable,each[Column1] = "disaster_start_date_gte"){0}[Column2],

    BaseUrl = "https://goadmin.ifrc.org",
    PageSize = 50,  // Number of items per page

    // Construct the query options based on parameter values
    queryOptions =
        [
            regions__in = if region <> null then Text.From(region) else "",
            disaster_start_date__gte = if disaster_start_date_gte <> null then Text.From(disaster_start_date_gte) else null,
            limit = Text.From(PageSize),
            offset = "0"
        ],

    // Define a function to retrieve a page of data
    GetPage = (offset) =>
        let
            Url = BaseUrl,
            Headers = if Token <> null then [#"Accept-Language"="en", #"Authorization"="Token " & Token] else [#"Accept-Language"="en"],
            Response = Json.Document(Web.Contents(Url, [Headers=Headers, RelativePath = "api/v2/event/", Query=queryOptions & [offset = Text.From(offset)]])),
            Results = Response[results]
        in
            Results,

    // Define a function to combine all pages of data
    CombineAllPages = List.Generate(
        () => [Offset = 0],
        each let page = GetPage([Offset]) in page <> null and List.Count(page) > 0,
        each [Offset = [Offset] + PageSize],
        each GetPage([Offset])
    ),

    // Convert the combined pages to a table
    #"Converted to Table" = Table.FromList(CombineAllPages, Splitter.SplitByNothing(), null, null, ExtraValues.Error),
    #"Expanded Column1" = Table.ExpandListColumn(#"Converted to Table", "Column1")
in
#"Expanded Column1"As you can see that the code is dynamically building a URL query string based on the conditions of the regions and disaster_start_date_gte variables. The summarized explanation of the two parameters used in queryOptions function is given below:
regions__inParameter: This line constructs theregions__inparameter in the query options.if region <> null then Text.From(region) else null: This ternary conditional statement checks if theregionvariable is not null. If it's not null, it converts theregionto text usingText.From(). Otherwise, it sets theregions__inparameter to null.disaster_start_date__gteParameter: This line constructs thedisaster_start_date__gteparameter in the query options.if disaster_start_date_gte <> null then Text.From(disaster_start_date_gte) else null: This ternary conditional statement checks if thedisaster_start_date_gtevariable is not null. If it's not null, it converts thedisaster_start_date_gteto text usingText.From(). Otherwise, it sets thedisaster_start_date__gteparameter to null.
- After the code has been pasted in the advance editor window, click on done. A series of steps will be added in the APPLIED steps on the right side of the query editor.
- After that the data can be expanded by selecting the necessary features/ columns. We can do this by clicking on the icon next to the name of the column.
- At this moment we will be expanding the columns of
field_reportsandcountriescolumns because we would like to plot the top 10 countries with the most number of deaths. - User can select any number of fields from the above mentioned columns but it is necessary to select
countries.nameandfield_reports.govt_num_injuredfrom thecountriesandfield_reportscolumns respectively. - Now we are able to see what data this query is actually providing. Also ensure that columns have correct data type so that visualization process can proceed without errors. We're ready to start building our visuals, so click on Close and Apply at the top of your Power Query Editor Window.
¶ Visualization in Power BI
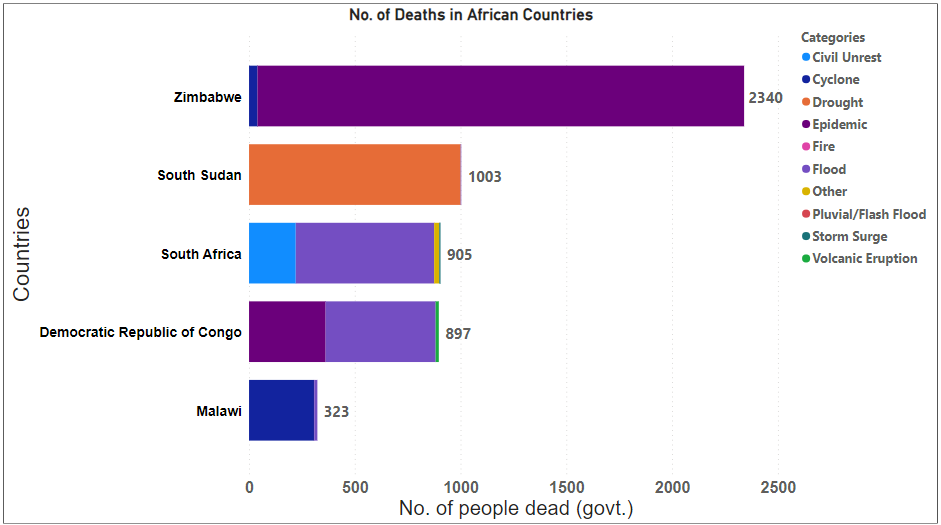
We will be visualizing the top 10 countries in Africa with the most number of deaths which will be further classified according to the disaster type. For this purpose we will be using the stacked bar chart visualization. The following steps can be followed:
- First select the stacked bar chart from the visualization pane and upon selection a blank placeholder will appear in the preview pane.
- From the data tab select the table which has the data of the events occurring in Africa. Drag the fields named
countries.nameinto the Y-axis. After that drag the field namedfield_reports.govt_num_injuredinto the X-axis. Power Bi will automatically show the countries with the number of deaths. - Next drag the field named
dtype.nameinto the Legend. The dtype.name contains disaster category names. - After that apply the filter Top N on countries.name and select N value as 5 to display the top 5 African countries with the most number of deaths along with the disaster type.
The visualization can be customized by changing the title names, sizes and colors of the labels. The following stacked bar chart visualization has been obtained after applying all the above steps with user's own customization.
We can see that Zimbabwe has the highest number of deaths of around 2340 as reported by the government. The major cause of these deaths was Epidemics.
¶ Using Python
To retrieve and analyze data using python, the following code can be used in jupyter notebooks. First we import the requests library which is used to send HTTP request to the API endpoint. Along with that we also import the matplotlib library for plotting the figure.
import requests
import matplotlib.pyplot as plt
import pandas as pdNext we define a function called fetchEvents to retrieve the data of emergency events. While retrieving the data we use two parameters namely regions_in and disaster_start_date_gte to filter the data according to the region and a starting date. The function will search for the data in all API pages and return the results in a list.
def fetchEvents(regions_in, disaster_start_date_gte):
    base_url = "https://goadmin.ifrc.org/api/v2/event/"
    offset = 0
    page_size = 50
    all_results = []
    auth_token = "your authorization token"

    while True:
        params = {
            "regions__in": regions_in,
            "disaster_start_date__gte": disaster_start_date_gte,
            "offset": offset,
            "limit": page_size
        }

        headers = {
            "Authorization": f"Token {auth_token}"
            # Add other headers if needed
        }

        response = requests.get(base_url, params=params, headers=headers)
        data = response.json()
        events = data.get("results", [])

        if not events:
            # No more results, break the loop
            break

        # Add fetched events to the results list
        all_results.extend(events)

        # Increment offset for the next page
        offset += page_size

    return all_results
After defining the function for retrieving the data we specify our search parameters. Here we will searching for emergency events in Africa occurring after 2012. We call the functions with the search parameters and convert the result into a pandas data frame.
regions_in = "0"  # Replace with your desired region IDs
disaster_start_date_gte = "2012-01-01T00:00:00"  # Replace with your desired start date
events_data = fetchEvents(regions_in, disaster_start_date_gte)
df = pd.DataFrame(events_data)
In the next steps we perform a series of data transformation processes. We make separate data frames for country names, number of deaths occurring due to disaster/ emergency as well as disaster/emergency category. Finally we concatenate these three datasets into a single dataset and name it as df_final.
df = df.explode("countries")
df = df.explode("field_reports")
df_country = pd.DataFrame(
    [country["name"] if pd.notnull(country) else None for country in df.countries],
    columns=["country.name"],
)

gov_num_dead_list = pd.DataFrame(
    [x["gov_num_dead"] if pd.notnull(x) else None for x in df["field_reports"]],
    columns=["num_dead"],
)

df_dtype = pd.DataFrame(
    [name["name"] if pd.notnull(name) else None for name in df["dtype"]],
    columns=["dtype.name"],
)
df_final = pd.concat([df_dtype, df_country, gov_num_dead_list], axis=1)
Again we carry out a series of data transformation processes to extract the data of top 5 countries in Africa with the most number of deaths. We group the data according to country name and disaster/ emergency type and calculate the total number of deaths. We store this result into a new data frame and name it as grouped_df. Later we select the top 5 countries based on the total number of deaths and store the result in the data frame grouped_top_df.
# Group by 'country.name' and 'dtype.name', summing the 'num_dead' values
grouped_df = (
    df_final.groupby(["country.name", "dtype.name"])["num_dead"].sum().reset_index()
)

# Select the top 5 countries based on the sum of 'num_dead'
top_countries = grouped_df.groupby("country.name")["num_dead"].sum().nlargest(5).index
grouped_top_df = grouped_df[
    grouped_df["country.name"].isin(top_countries)
].reset_index()

grouped_top_df["num_dead"] = grouped_top_df["num_dead"].astype(int)

sorted_df = (
    grouped_top_df.groupby("country.name")["num_dead"]
    .sum()
    .reset_index()
    .sort_values(by="num_dead", ascending=True)
)

# Reorder the 'country.name' column based on the sorted order
grouped_top_df["country.name"] = pd.Categorical(
    grouped_top_df["country.name"], categories=sorted_df["country.name"], ordered=True
)
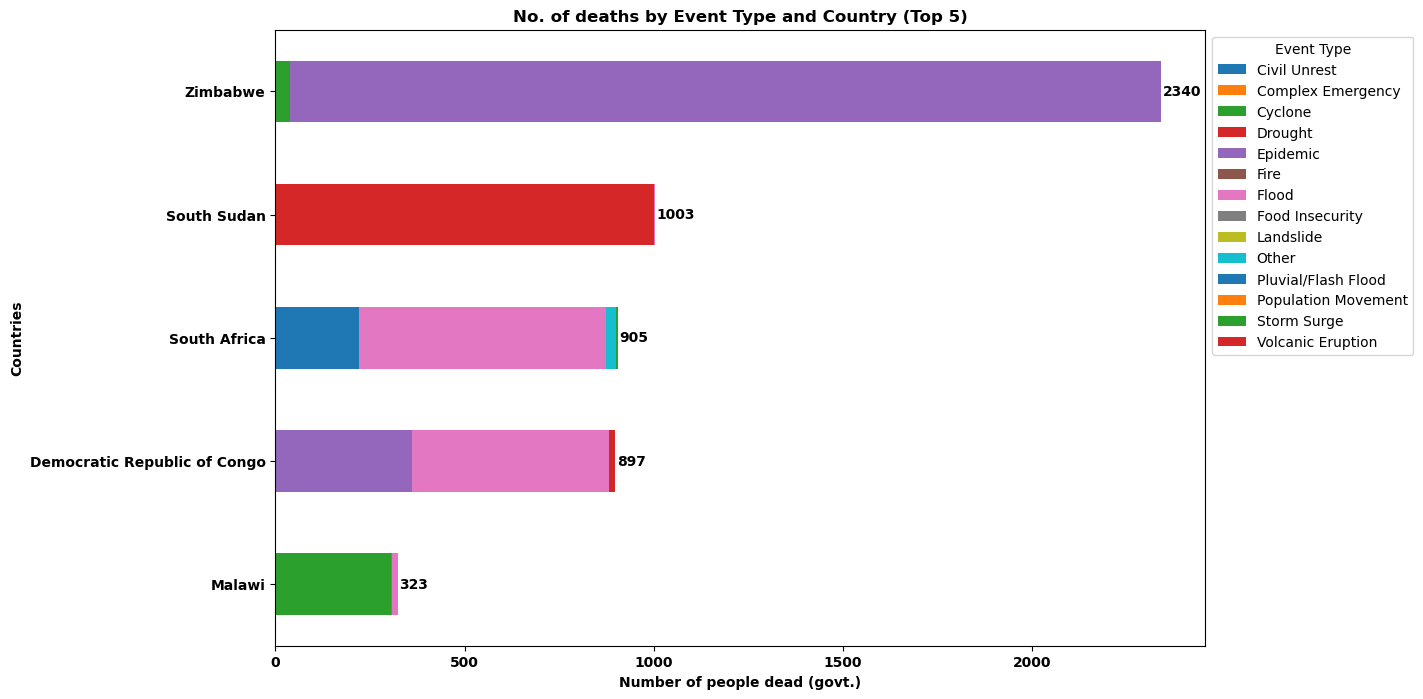
Finally we plot the results for the top 5 countries in Africa with the most number of deaths categorized by disaster/ emergency type. we plot the results in a horizontal stacked bar/column chart. Users can specify and change the plotting style/ color or theme. We can clearly see from the figure that Zimbabwe registered the highest number of deaths and highest proportion of deaths in Zimbabwe occurred to due various Epidemics.
# Plot data in a horizontal stacked bar manner
ax = df_pivoted.plot(kind="barh", stacked=True, figsize=(12, 8))

# Add data labels for the total values next to each bar
for idx, value in enumerate(df_pivoted.sum(axis=1)):
    ax.text(value + 5, idx, str(int(value)), va="center", fontweight="bold")


# Add labels
plt.xlabel("Number of people dead (govt.)", fontweight="bold")
plt.ylabel("Countries", fontweight="bold")

# Make labels and ticks bold
plt.xticks(fontweight="bold")
plt.yticks(fontweight="bold")

plt.title("No. of deaths by Event Type and Country (Top 5)", fontweight="bold")
plt.legend(title="Event Type", bbox_to_anchor=(1, 1))